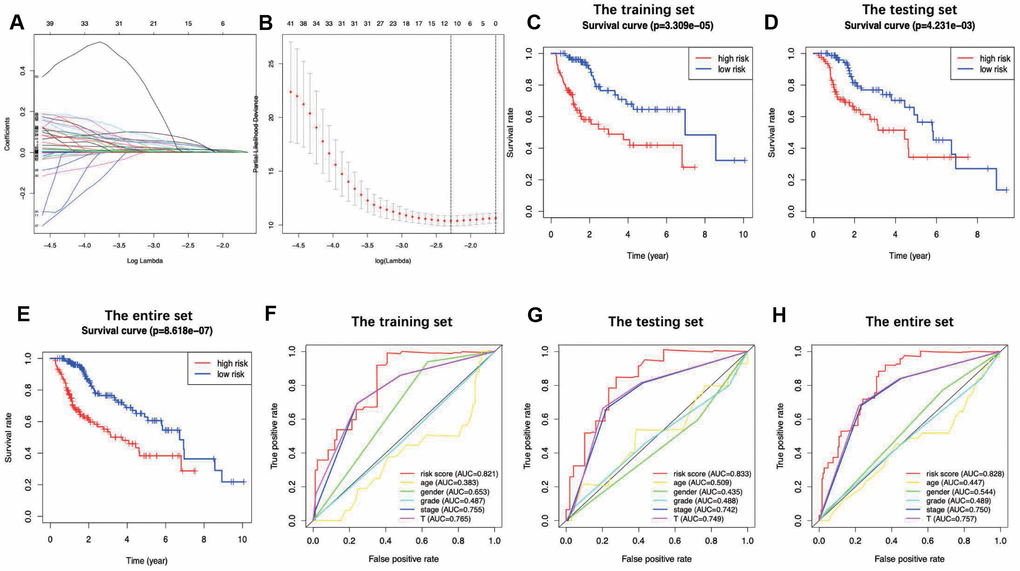
Figure 3.LASSO coefficient profiles of the 7 immune genes are depicted in (A, B) show the selection of the tuning parameter (lambda) in the LASSO model by tenfold cross-validation based on minimum criteria for OS; the lower X axis shows log (lambda), and the upper X axis shows the average number of OS-genes. The Y axis indicates partial likelihood deviance error. Red dots represent average partial likelihood deviances for every model with a given lambda, and vertical bars indicate the upper and lower values of the partial likelihood deviance errors. The vertical black dotted lines define the optimal values of lambda, which provides the best fit. Survival curves of patients in high risk group and low risk group of the training set (C), the testing set (D) and the entire set (E) are shown. Patients in high-risk group suffered shorter overall survival. (F–H) show survival-dependent receiver operating characteristic (ROC) curves validation at 1 – year of prognostic value of the prognostic index in the three sets (the training set, the testing set and the entire set, respectively).