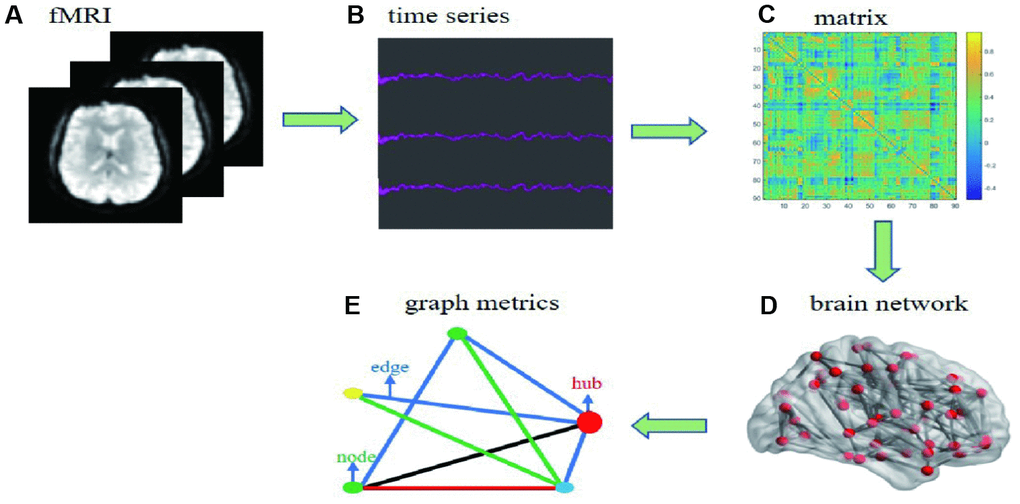
Figure 6.Flow chart of date processing for resting functional MRI. (A) individual fMRI images were used for parceling the distinct brain regions. (B) time series were collected after the pretreatment based on bold oxygenation level dependent. (C) functional connectivity matrix between node i and j was constructed. (D) individual brain network was collected. (E) simple model diagram for graph theory analysis.