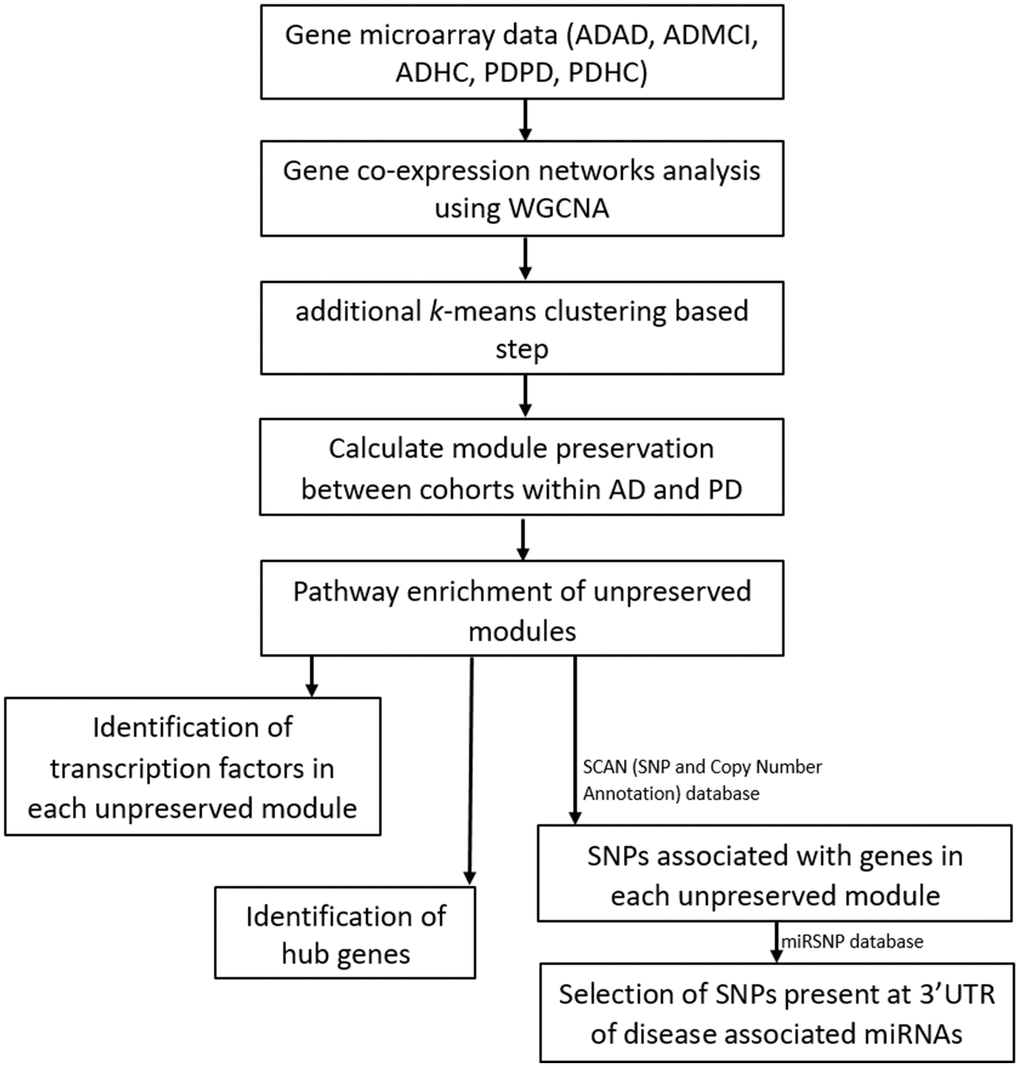
Figure 1.Workflow of our analysis. Filtered and normalized microarray data were separated into five datasets: AD disease (ADAD), healthy control (ADHC) and MCI (ADMCI) data from the AD dataset, and the PD disease (PDPD) and healthy control (PDHC) data from the PD dataset. On each dataset gene co-expression networks analysis was performed using the WGCNA R package [15]. An additional k-means correction step to reduce number of misplaced genes [70] was then performed and module preservation between cohorts within AD and PD was found using NetRep (v.1.2.1) [18]. The pathways associated with non-preserved modules were then found using the Enrichr web tool [19, 20] and hub genes and transcription factors in these non-preserved modules identified. The SCAN (single nucleotide polymorphism (SNP) and Copy number ANnotation) database) database [25] was used to find SNPs associated with the genes in each non-preserved module and these SNPs used to search the MiRSNP database to find the SNPs at 3’ UTR of disease associated miRNAs.
Figure 1 — Genetic networks in Parkinson’s and Alzheimer’s disease | Aging