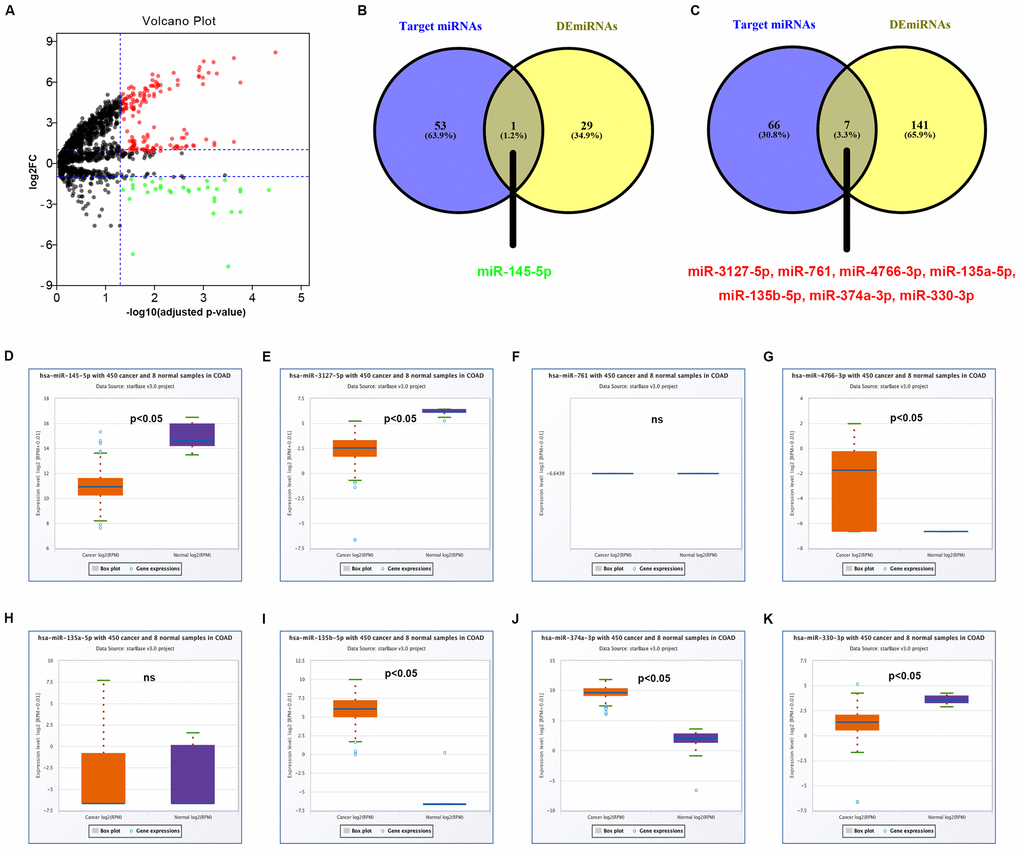
Figure 4.Identification of potential miRNAs that bind to circRNAs in colorectal cancer. (A) The volcano plot of differentially expressed miRNAs (DEmiRNAs) in colorectal cancer from GSE126093 dataset. The red dots and green dots represent upregulated DEmiRNAs and downregulated DEmiRNAs with significance (adjusted P-value < 0.05 and |log2FC| > 1), respectively. The black dots are those DEmiRNAs without significance. (B) The intersection analysis of target miRNAs of upregulated circRNAs and downregulated DEmiRNA. (C) The intersection analysis of target miRNAs of downregulated circRNAs and upregulated DEmiRNA. (D) The expression level of hsa-miR-145-5p in COAD. (E) The expression level of hsa-miR-3127-5p in COAD. (F) The expression level of hsa-miR-761 in COAD. (G) The expression level of hsa-miR-4766-3p in COAD. (H) The expression level of hsa-miR-135a-5p in COAD. (I) The expression level of hsa-miR-135b-5p in COAD. (J) The expression level of hsa-miR-374a-3p in COAD. (K) The expression level of hsa-miR-330-3p in COAD. “p<0.05” represents significant difference and “ns” represents no significance.