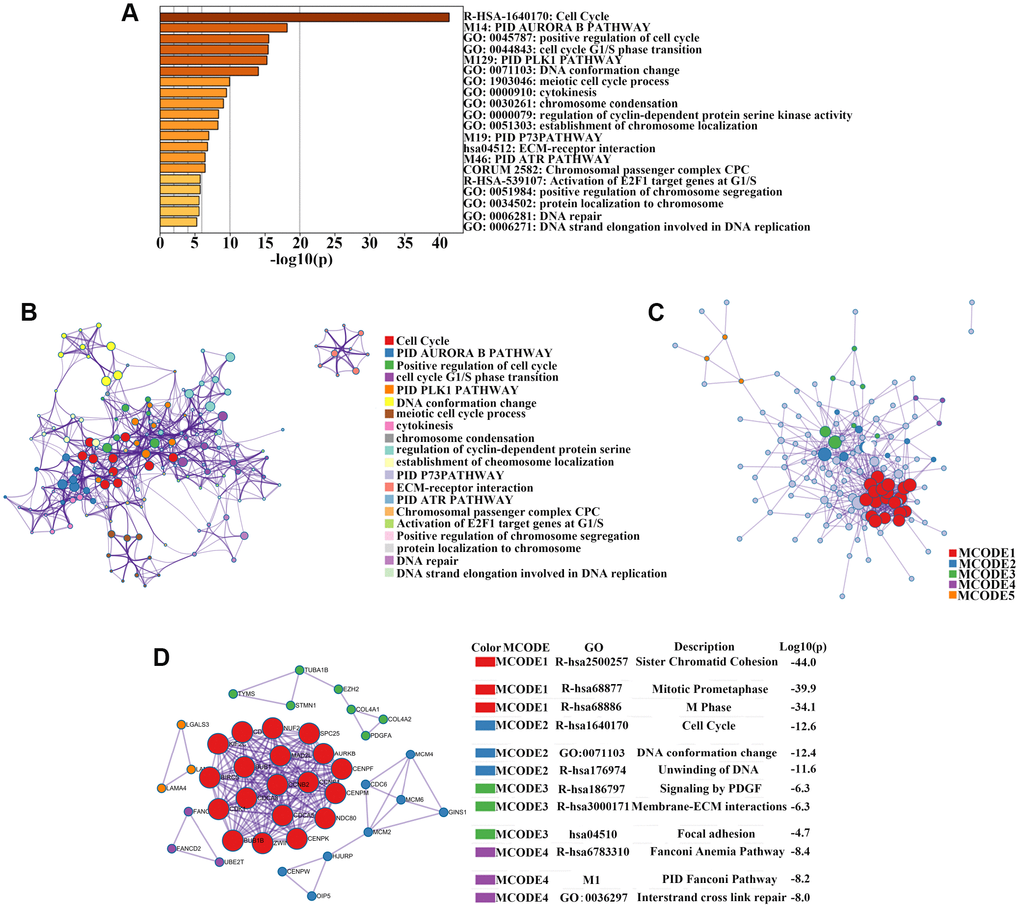
Figure 2.Enrichment analysis, protein–protein interaction (PPI) network construction, and module analysis. (A) Metascape bar graph to view the top 20 non-redundant enrichment clusters of upregulated genes. The enriched biological processes were ranked by p-value. A deeper color indicates a smaller p-value. (B) Metascape visualization of the networks of the top 20 clusters. Each node represents one enriched term colored by cluster ID; nodes that share the same cluster are typically close to each other. Node size is proportional to the number of input genes falling into that term. Thicker edges indicate higher similarity. (C) PPI network construction of upregulated genes. (D) Four sub-networks were identified by Cytoscape MCODE plug-in analysis. Ingenuity pathway analysis of genes in each sub-network to obtain the biological pathways.