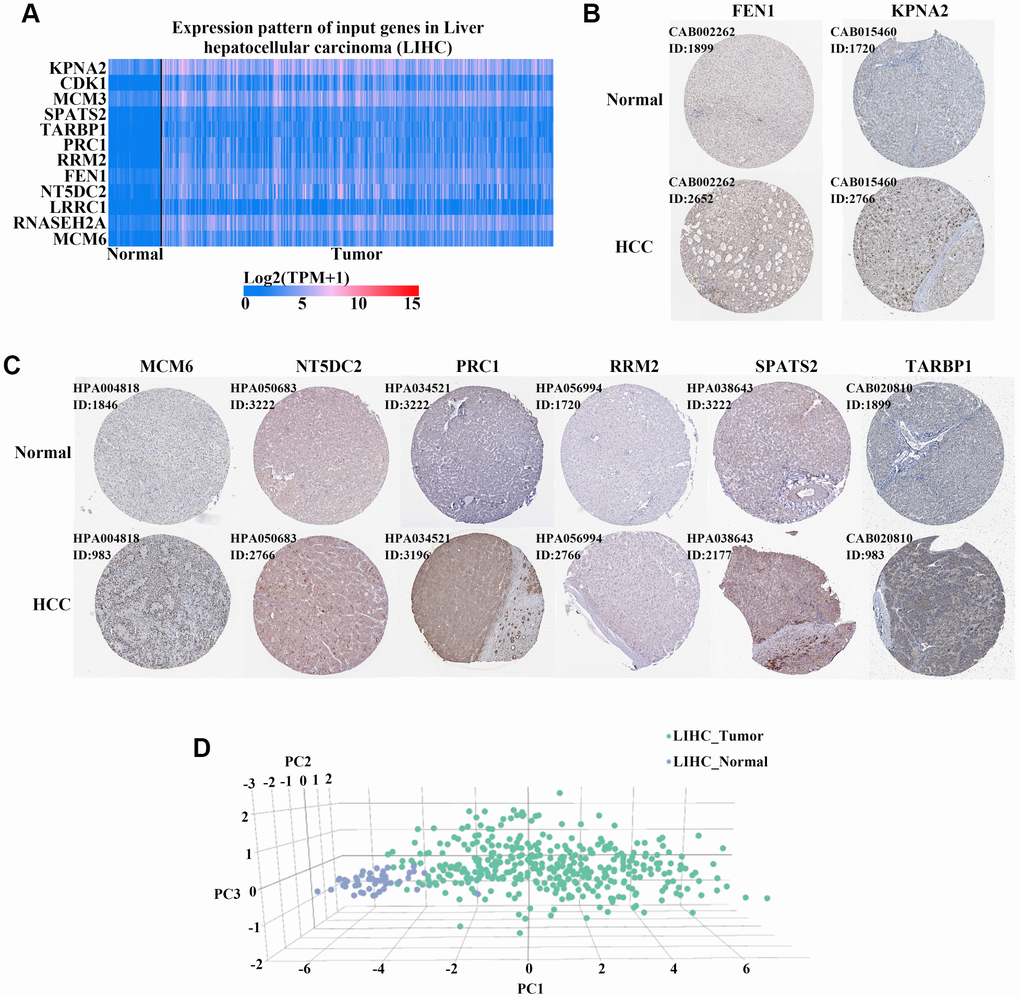
Figure 4.Verification of the expression of 12 hub genes in HCC. (A) Heatmaps of the levels of 12 hub genes comparing HCC and normal liver tissues in the TCGA cohort. Red and blue colors indicate higher and lower expression, respectively. (B–C) Eight hub genes were upregulated in HCC compared to expression in normal tissues based on immunohistochemical staining analysis of the Human Protein Atlas database. Antibody numbers and patient/healthy control ID numbers were annotated. (D) Three-dimensional (3D) principle component analysis (PCA) score plot showing that HCC patients can be effectively distinguished from healthy controls based on the expression of these 12 genes.