Submit an Article
Navigate
Home
Editorial Board
Editorial Policies
Current Volume
Archive
Scientific Integrity
Publication Ethics Statements
Interviews with Outstanding Authors
Newsroom
Sponsored Conferences
Podcast
Contact
Special Collections
Submit an Article
Online ISSN: 1945-4589
Research Paper
|
Volume 12, Issue 6
|
pp. 5479–5499
Prognostic values of immune scores and immune microenvironment-related genes for hepatocellular carcinoma
Back to article
Figure 10
(10 of 12)
−
100%
+
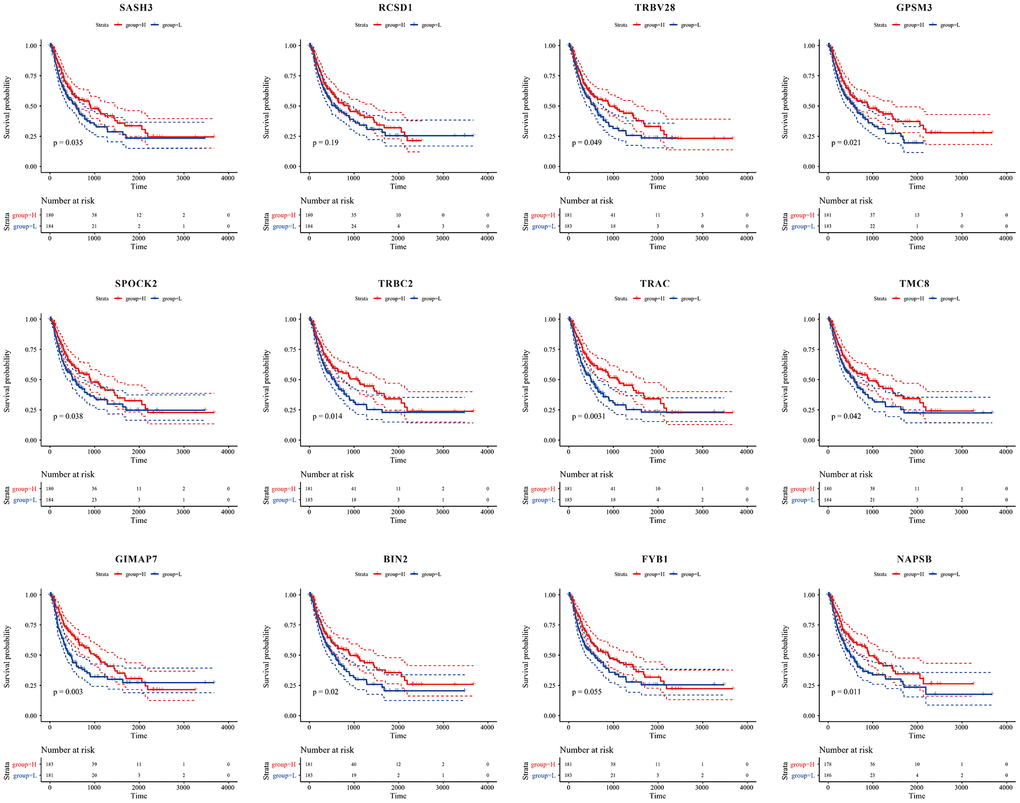
Figure 10.
Kaplan-Meier curve for prognostic analysis of the 12 immune microenvironment genes.
The red dotted line and blue dotted line respectively represented upper and lower limit of 95% confidence intervals of gene expression.