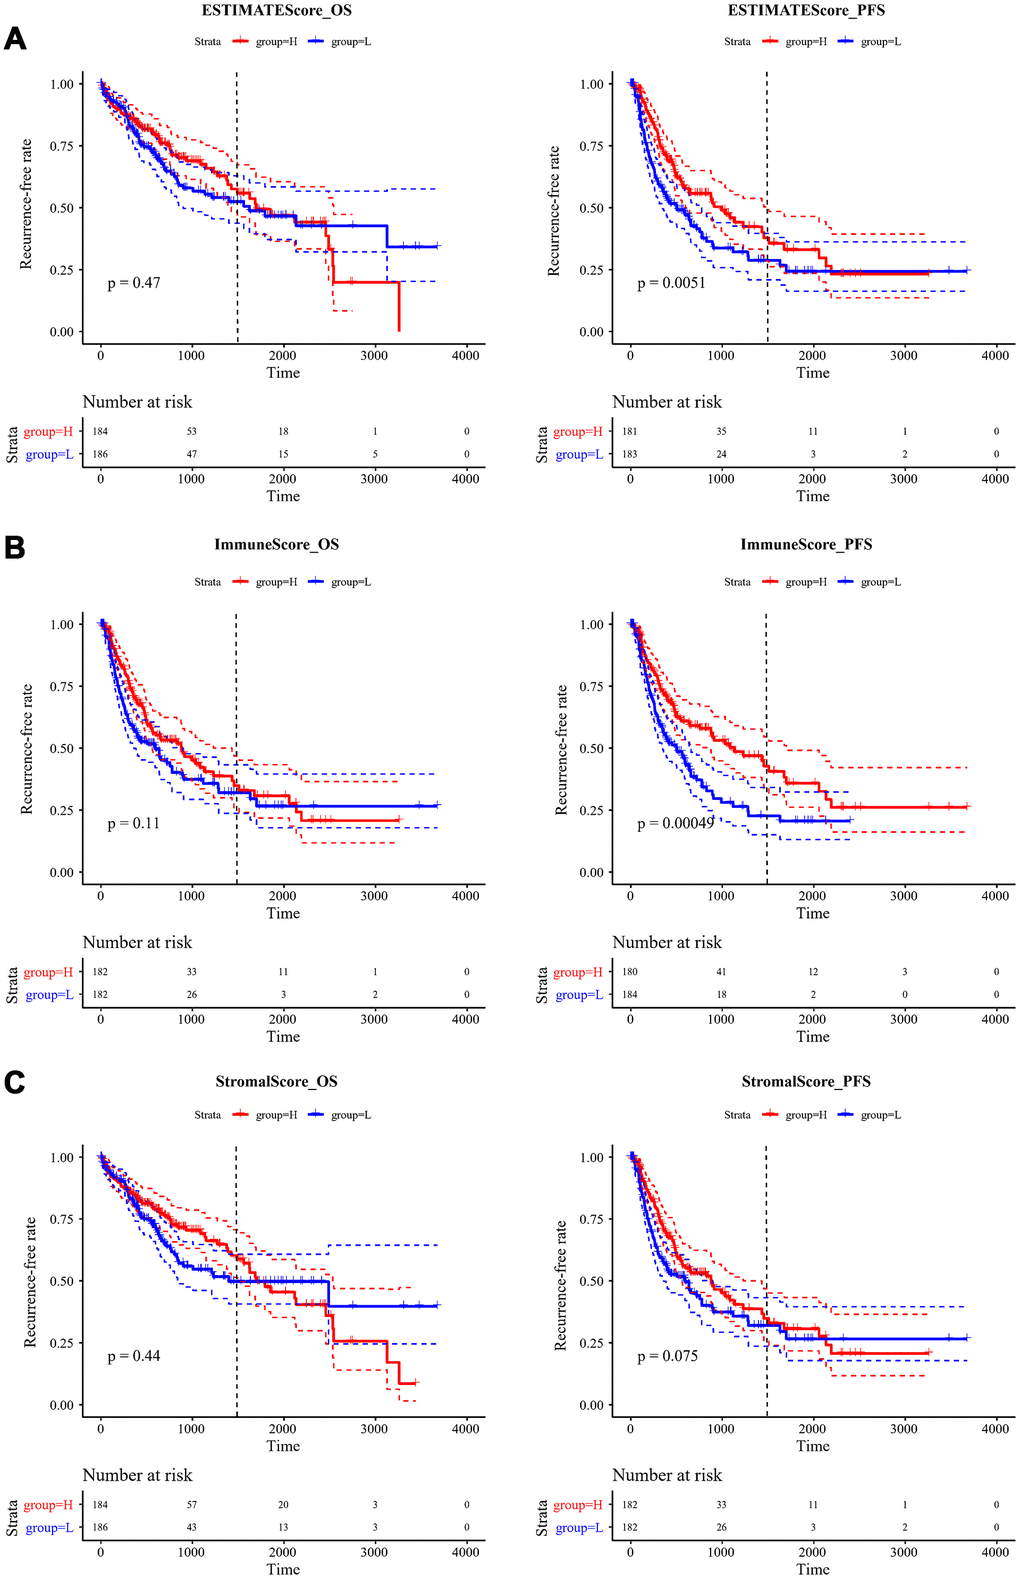
Figure 4.Kaplan-Meier curve for recurrent analysis of overall survival time and progression-free survival time by immune scores. (A) ESTIMATEScore, (B) ImmuneScore, (C) StromalScore. H (red solid line) and L (blue solid line) respectively represented high-score group and low-score group. The red dotted line and blue dotted line respectively represented upper and lower limit of 95% confidence intervals. The vertical dotted line was at 4 years. OS, overall survival time; PFS, progression-free survival time.