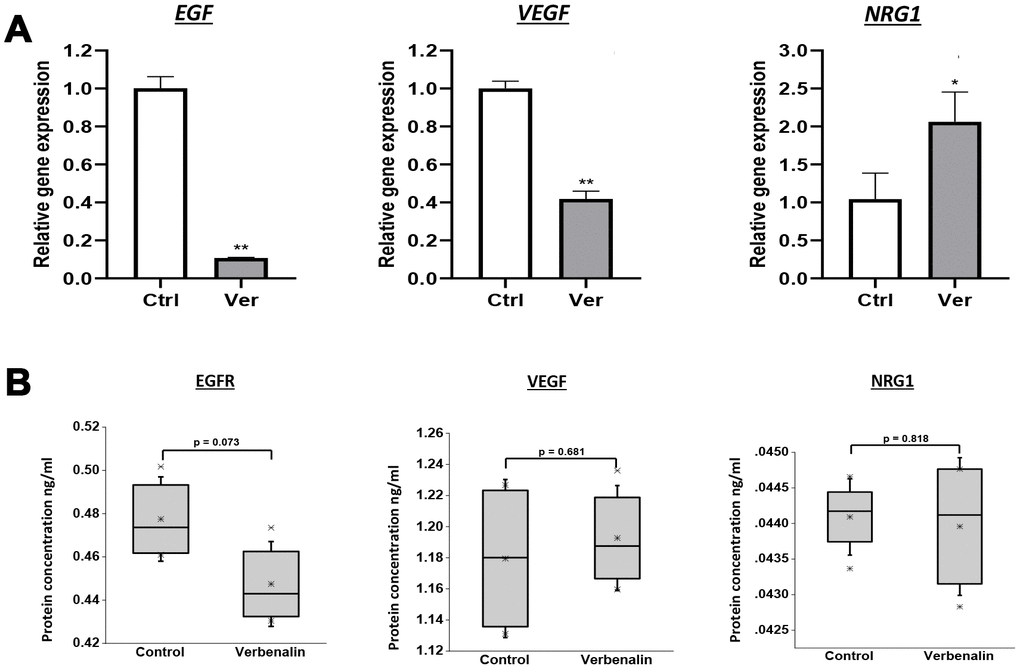
Figure 4.Effect of verbenalin treatment on the expressions of EGF, VEGF, and NRG1. The hAECs were treated with 20 μM of verbenalin (Ver) for 7 days, while the control cells were maintained in the placental basal medium. (A) Gene expressions were evaluated by real-time PCR. Each value represents the mean ± SD (n = 3). Asterisks refer to statistical significance (*p < 0.05, **p < 0.01) by One-way ANOVA as compared with control (Ctrl). (B) Boxplots of protein concentration (ng/ml) obtained by ELISA (n = 4). Box ranges from 25th to 75th percentile, the line in the middle represents the median value, the whiskers represent the min, max, and mean values, and the error bar represents the SD. The difference in protein concentration between treatment and control group was measured using One-way ANOVA for linear distribution.