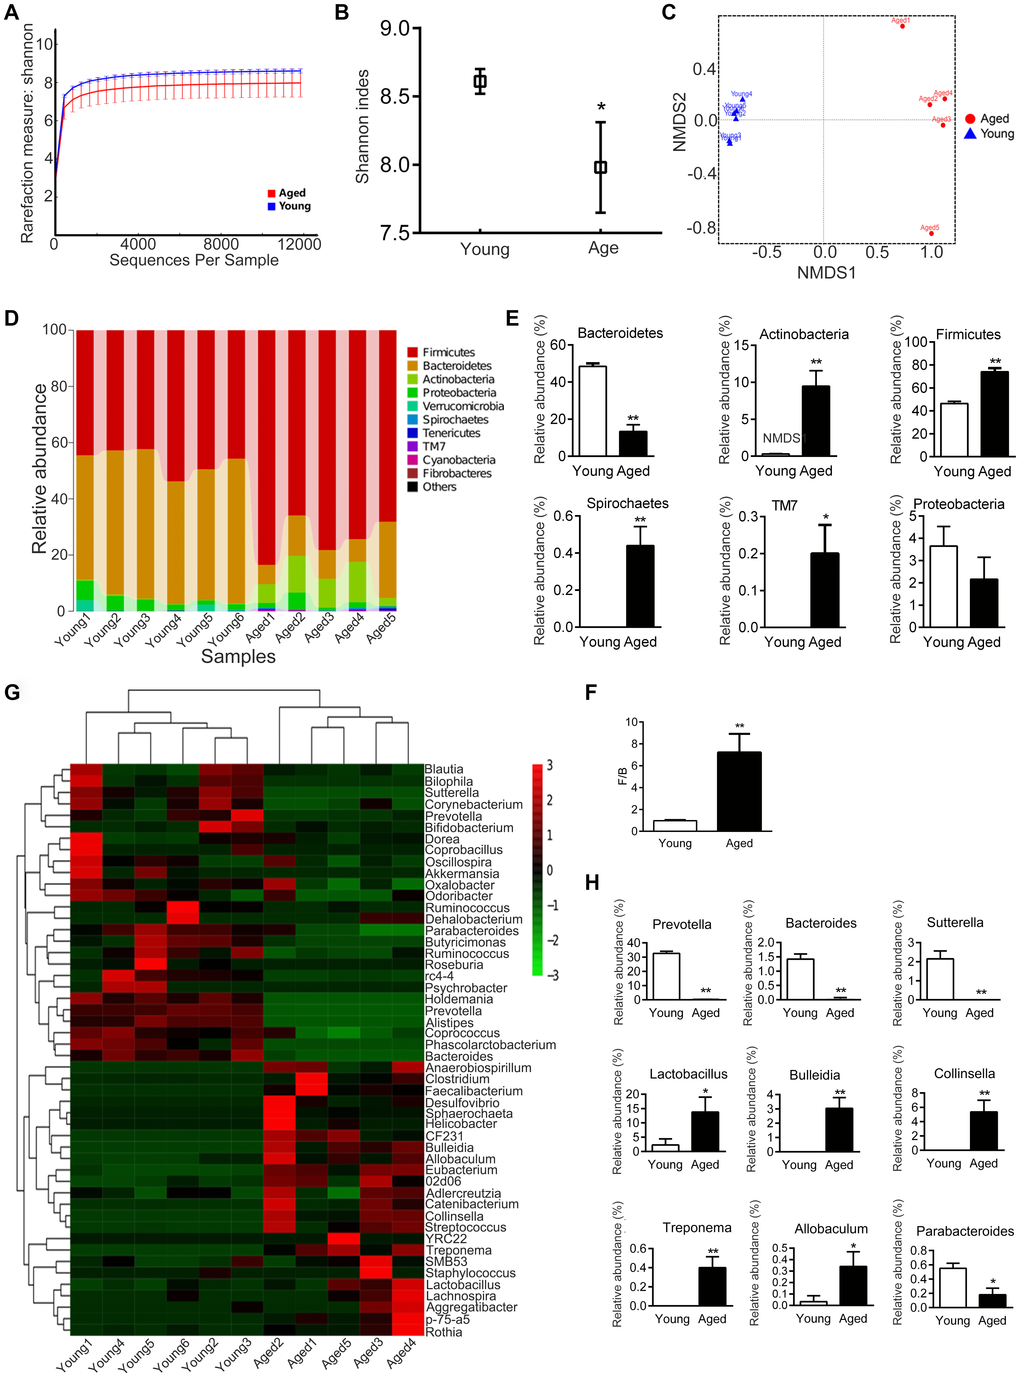
Figure 4.Gut microbiota varies between young and aged rats. n = 5. (A) Rarefaction curve. (B) Shannon diversity index; the higher the Shannon index, the higher the diversity of the community. (C) Weighted UniFrac Nonmetric Multidimensional Scaling (NMDS); the distance between two points indicates the similarity of microbial structure. (D) Relative abundance of bacteria at phylum in each sample; each column represents one sample. (E) Phyla with significant differences between young and aged rats. (F) Ratio of Firmicutes/Bacteroidetes (F/B). (G) Heatmap of community composition at genus by cluster analysis. The illustration in the top right corner shows the difference in the expression of bacteria from -3 (green) to +3 times (red). Compared with young rats, red represented an increase in number and green represented a decrease. (H) Genera with significant differences between young and aged rats; * P < 0.05, ** P < 0.01