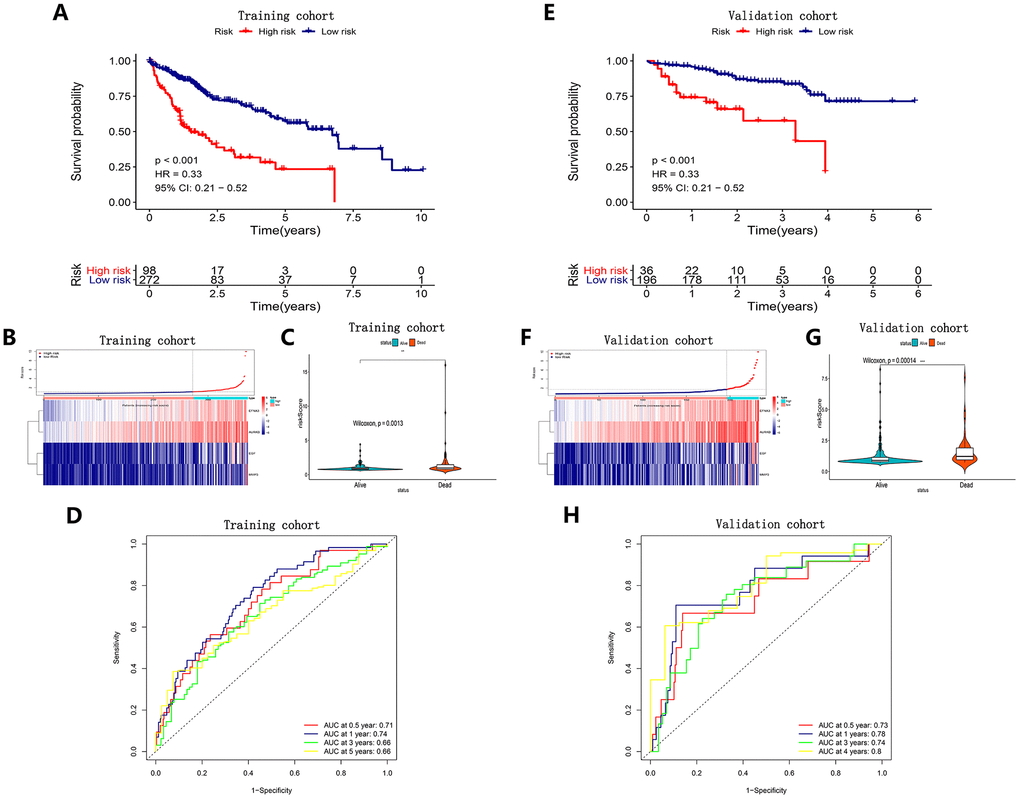
Figure 2.Survival analysis, risk score distribution, Violin plots and time-dependent ROC curves of a prognostic model in the TCGA HCC cohort (A–D) and ICGC HCC cohort (E–H). A and E K-M survival curves showed the OS in the high-risk group was significantly worse than that in the low-risk group (P<0.05). (B, F) Distribution of risk scores of HCC patients with different gene expression levels. (C, G) Risk scores of HCC patients with different survival status. (D, H) ROC curve analysis for OS prediction.