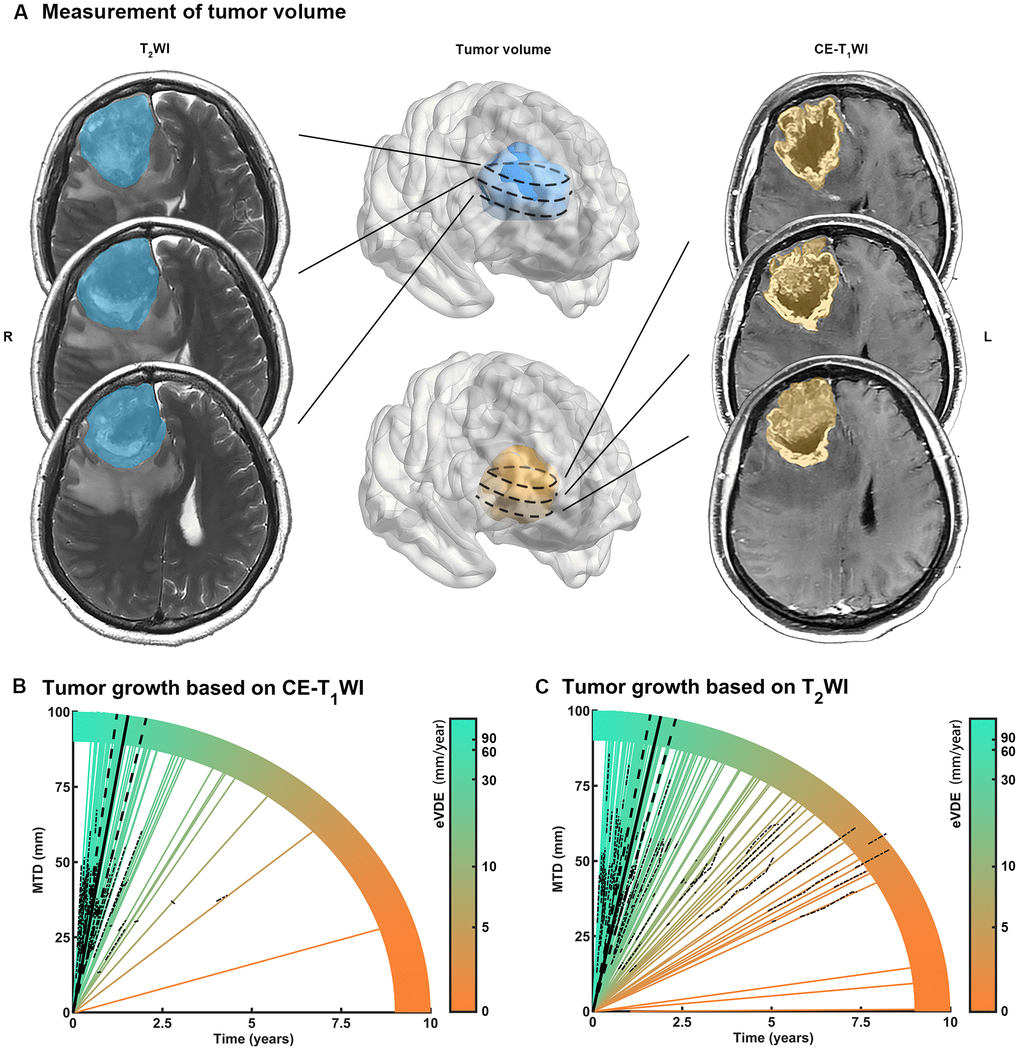
Figure 1.Measurement of tumor growth rate in high grade gliomas (HGGs). (A) Mean tumor diameter (MTD) was calculated for tumor volume measured by preoperative MR images. (B, C) Tumor growth trajectories for each patient (colored lines) were aligned with MTD evolution with time (dotted lines). The equivalent velocity of diameter expansions (eVDEs), which represented the slope of tumor growth trajectory, estimated on T2WI (eVDE, 51.6 mm/year; 95% confidence interval [CI], 41.5-61.0 mm/year) and contrast-enhanced T1-weighted image (CE-T1WI) (eVDE, 64.3 mm/year; 95% CI, 47.8-90.7 mm/year) were shown in black lines.