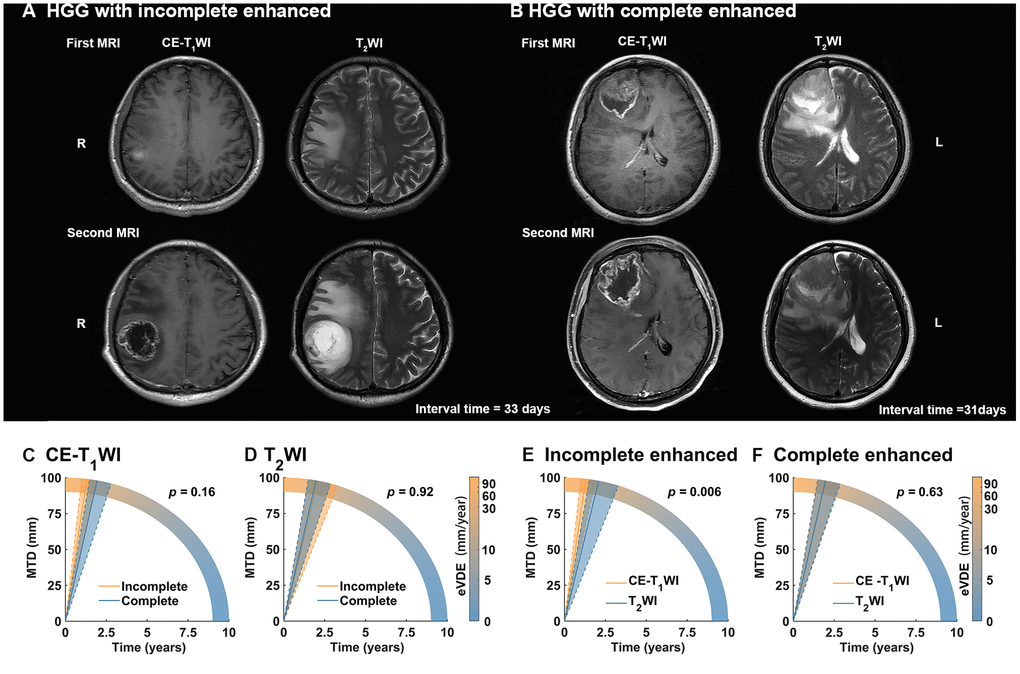
Figure 3.Tumor growth rate in different contrast enhancement (CE) type. (A, B) The longitudinal contrast-enhanced T1-weighted image (CE-T1WI) and T2WI MR-images with incomplete enhanced and complete enhanced high-grade gliomas (HGGs), respectively. (C, D) For HGGs with two or more CE- T1WI MR images (n = 54), equivalent velocity of diameter expansions (eVDEs) in different CE type based on T2WI (represented tumor entity) and CE-T1WI (represented tumor enhanced area) showed no significant difference (p > 0.05). (E, F) HGGs with incomplete enhanced showed significant faster eVDEs in tumor enhanced area than tumor entity (p = 0.006). However, HGGs complete enhanced showed no significant difference in eVDEs between tumor enhanced area and tumor entity (p = 0.63).