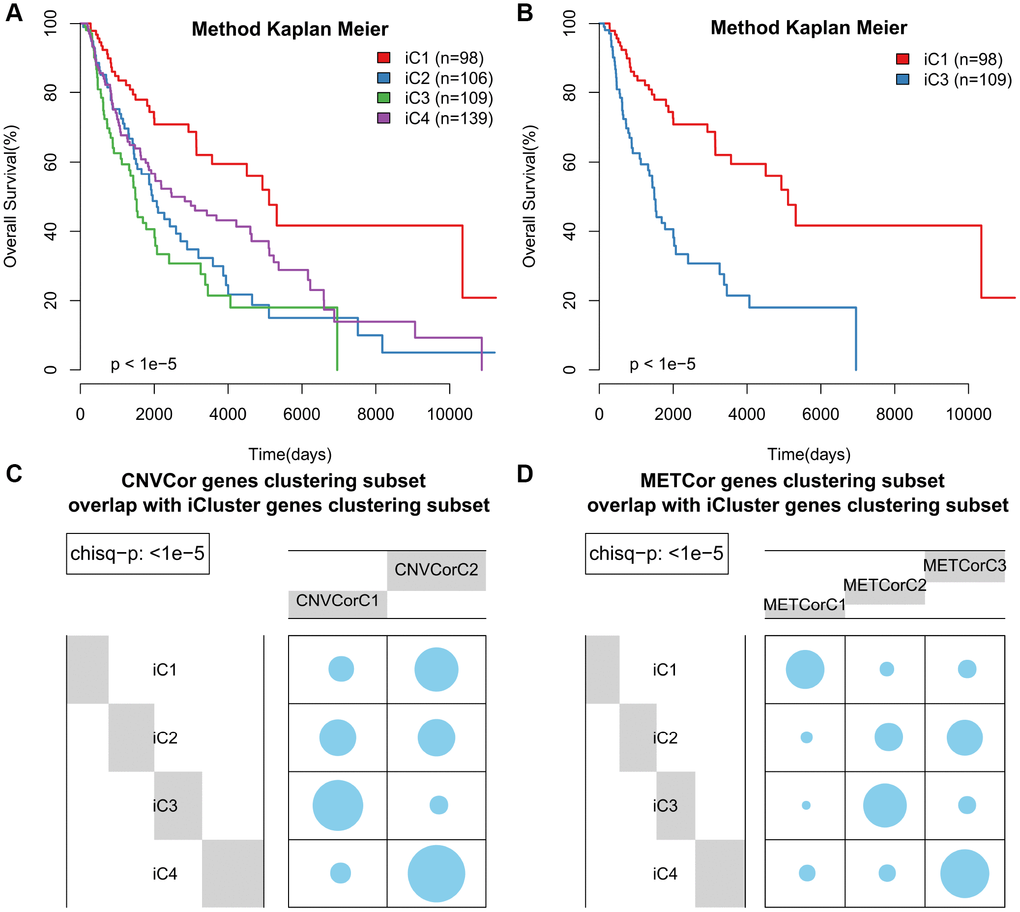
Figure 4.Identification of SKCM molecular subtypes using iCluster analysis. (A) Kaplan–Meier plot analyses of differences in OS among subtypes identified by iCluster (iC1, iC2, iC3, and iC4). (B) Kaplan–Meier plot analyses of OS in iC3 and iC1 subtypes. (C, D) The subtypes determined through iCluster analysis overlapped extensively with those based on CNVcor (C) or METcor (D) genes.