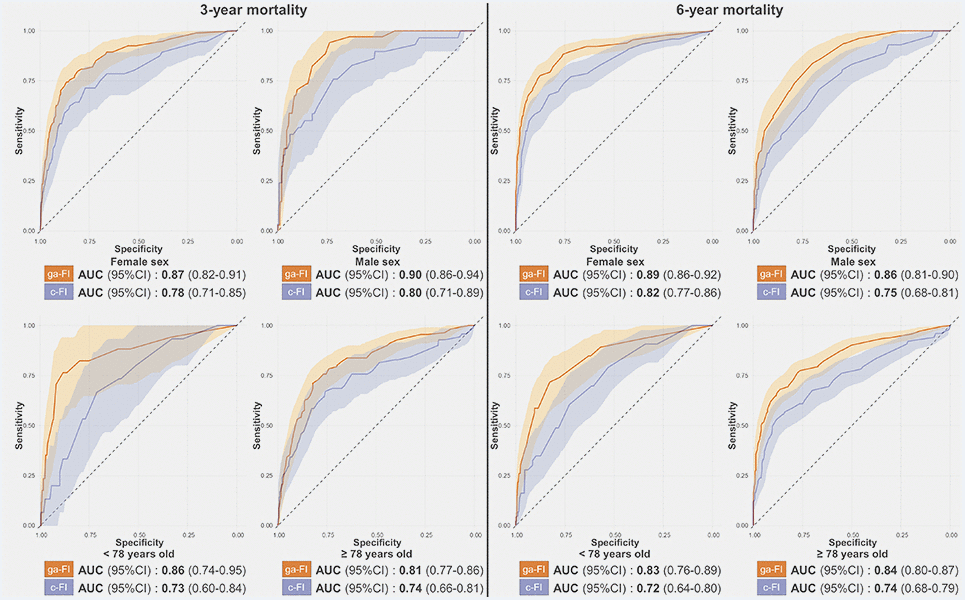
Figure 3.Receiver-Operating-Characteristics Curve and Areas Under the Curve (AUC) for the prediction of 3-year and 6-year mortality obtained for the ga-FI and c-FI in the test sample, in different subsamples. Abbreviations: 95% CI = 95% confidence intervals; ga-FI = best genetic algorithm-derived Frailty Index; c-FI = clinically generated Frailty Index.