


Introduction
With age, an individual’s likelihood of experiencing chronic disorders, loss of functionality, cognitive problems, and of dying increases. Similarly, the ability to recover from acute events, such as a hip fracture or pneumonia, decreases or is even absent [1, 2]. This resilience reduction is due to the progressive accumulation of biological deficits across different organs and systems, which progressively leads to a loss of homeostasis, eventually failing to support the organism [3, 4]. The concept of frailty has been proposed to measure such a process in clinical and research settings [5, 6].
During the last two decades, a number of different clinical operationalizations of frailty have been developed, among which is the frailty index (FI) [5, 7]. The FI is a powerful measure of biological age that, through the assessment of clinically observable health deficits (e.g. diseases, signs, symptoms, poor physical and cognitive function etc.), attempts to capture the biological entropic burden proper to each aging individual [8, 9], easing risk evaluation and prediction of negative health-outcomes (e.g. death, hospitalizations, falls, and post-procedure adverse events [10–17]). A high number of FIs have been built across different patient populations, settings and countries [10, 18]. During the last years, several other medical specialties embraced the concept of frailty, resulting in frequent implementation of FIs in daily clinical practice. For example, the FI is currently used to assess the risk to a patient’s before invasive procedures, to choose a given chemotherapy, or for prognostic evaluation in particular subsets of patients [19–24]. There are also examples of FIs adopted on a large scale, as is the case of the electronic FI used in UK primary care, which recently revolutionized the decision-making process of British general practitioners [25].
A FI is calculated as the ratio between the number of clinical deficits presented by an individual and the overall number of deficits taken into consideration [26]. Although seminal papers [7, 26, 27] offered a set of rules to identify deficits among the available variables, an objective procedure to select the deficits to include in a FI is lacking. For this reason, currently available FIs are mainly built based on the clinical experience of their users. However, this approach may not be sufficiently accurate to predict health outcomes in particular subgroups of individuals. For example, we previously showed that a clinical FI loses a significant part of its discriminative capacity in predicting mortality and hospitalizations when applied to younger individuals (i.e. <80 years old), probably due to scarcity of deficits discriminating health status at younger ages [17]. In this regard, an objective deficit selection based on the target outcome, instead of on clinical expertise, would allow the building of highly reliable data-driven FIs.
With this study, we propose the application of an optimization algorithm—the genetic algorithm, a well-known tool employed to solve optimization problems [28]— to create a FI based on our prediction goals, rather than on a predetermined clinical selection of deficits. Genetic algorithms have been extensively employed to find near-optimal solutions to complex problems in the presence of a non-manageable number of possible alternatives [29]. For the aim of this study, we personalized a genetic algorithm to create a FI for mortality prediction in older people, characterized by a high prognostic accuracy both in the whole population and in sex and age subsamples. We used data from the population-based Swedish National Study on Aging and Care in Kungsholmen. In this article, we provide proof of concept, namely, that the FI built through a genetic algorithm exhibits a higher predictive performance—stable across subsamples and time windows—than that shown by a FI whose deficits were clinically selected.
Results
Implementation of the genetic algorithm
A genetic algorithm is an optimization algorithm inspired by Darwin’s theory of evolution; it is employed to identify solutions to computationally complex problems through the principle of the “survival of the fittest” [28]. We implemented a genetic algorithm (Figure 1A) that, starting from 1100 randomly generated FIs, using the areas under the curve (AUC) as a metric of fitness assessment, and after a sufficient number of iterations (Figure 1B), identified a near-optimal FI (see Methods section for details). Each FI generated and tested by the GA was obtained as described in previous studies [7, 26]: the GA calculated the ratio between the number of deficits exhibited by each person and the total number of deficits chosen among those available (more details in the Methods section and Supplementary Table 3). The GA did not transform the deficits or assign any weights to the deficits included in the FIs. The data used for this study were obtained from the Swedish National Study on Aging and Care in Kungsholmen (SNAC-K), an ongoing population-based study started in 2001. The baseline characteristics of the study sample, randomly selected from the general population, are described in Table 1. The average age was 74.7 years (SD 11.2); 64.9% were female (N = 2182). Less than 6% of the participants were living in an institution and the prevalence of disability was 10%. All participants were clinically examined by physicians and nurses.
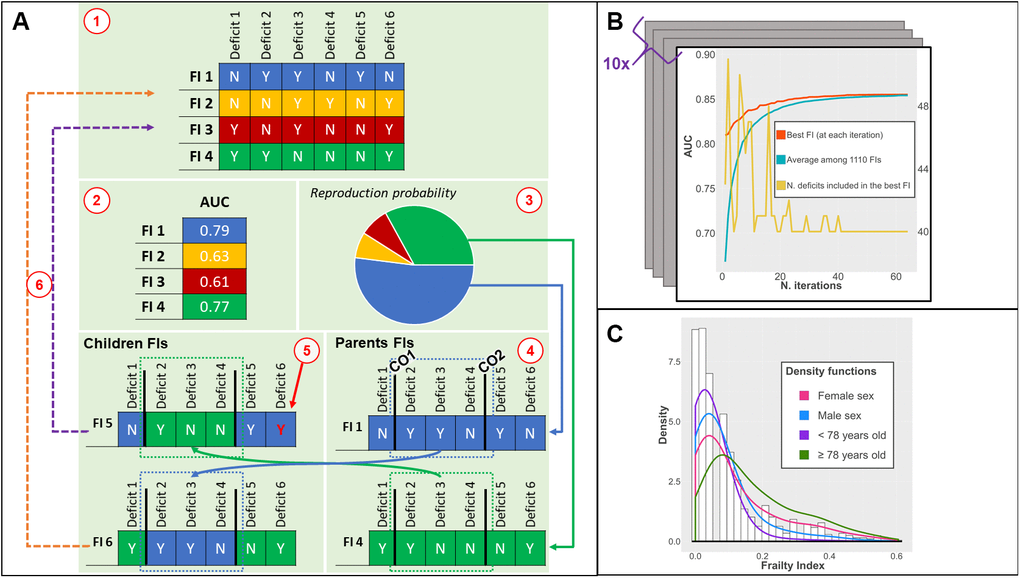
Figure 1. (A) Phases of the genetic algorithm: 1) an initial population of FIs is created; 2) the fitness (AUC) of each FI is tested; 3) the fittest FIs have higher chances to be selected for recombination; 4) two crossing-over points are randomly found for each parent FI: children FIs are created by combining different parts of parents FI; 5) a low probability of random mutations of a deficit is introduced; 6) children FIs replace the least fit FI; (B) Output of the genetic algorithm: iteration by iteration, the AUC of the best FI and average AUC of the population of FIs increases until convergence. The number of deficits included can vary iteration by iteration; (C) Distribution of the ga-FI in the whole population (histogram) and density functions in different subsamples. Abbreviations: FI = Frailty Index, AUC = Area under the Curve, CO = Crossing Over point; ga-FI = best genetic algorithm-derived FI.
Table 1. Baseline characteristics of the SNAC-K population in the whole dataset, and in the training and test samples.
| Characteristics, N (%) | Total N = 3363 | Training sample N = 2354 (70%) | Test sample N = 1009 (30%) | p | |||||||||||||||||||||||||||||||||||||||||||||||||||||||||||||||||||||||||||||||||||||||||||||||
| Demographic | |||||||||||||||||||||||||||||||||||||||||||||||||||||||||||||||||||||||||||||||||||||||||||||||||||
| Age, mean (SD) | 74.7 (11.2) | 74.9 (11.2) | 74.3 (11.1) | 0.217 | |||||||||||||||||||||||||||||||||||||||||||||||||||||||||||||||||||||||||||||||||||||||||||||||
| Female sex | 2182 (64.9%) | 1532 (65.1%) | 650 (64.4%) | 0.713 | |||||||||||||||||||||||||||||||||||||||||||||||||||||||||||||||||||||||||||||||||||||||||||||||
| Living in institution | 191 (5.7%) | 138 (5.9%) | 53 (5.2%) | 0.484 | |||||||||||||||||||||||||||||||||||||||||||||||||||||||||||||||||||||||||||||||||||||||||||||||
| Chronic diseases | |||||||||||||||||||||||||||||||||||||||||||||||||||||||||||||||||||||||||||||||||||||||||||||||||||
| ≥2 chronic conditions | 2900 (86.2%) | 2019 (85.8%) | 881 (87.3%) | 0.233 | |||||||||||||||||||||||||||||||||||||||||||||||||||||||||||||||||||||||||||||||||||||||||||||||
| Atrial fibrillation | 324 (9.6%) | 229 (9.7%) | 95 (9.4%) | 0.778 | |||||||||||||||||||||||||||||||||||||||||||||||||||||||||||||||||||||||||||||||||||||||||||||||
| Heart failure | 353 (10.5%) | 245 (10.4%) | 108 (10.7%) | 0.798 | |||||||||||||||||||||||||||||||||||||||||||||||||||||||||||||||||||||||||||||||||||||||||||||||
| Ischemic heart disease | 514 (15.3%) | 374 (15.9%) | 140 (13.9%) | 0.137 | |||||||||||||||||||||||||||||||||||||||||||||||||||||||||||||||||||||||||||||||||||||||||||||||
| COPD | 167 (5%) | 108 (4.6%) | 59 (5.8%) | 0.123 | |||||||||||||||||||||||||||||||||||||||||||||||||||||||||||||||||||||||||||||||||||||||||||||||
| Dementia | 322 (9.6%) | 234 (9.9%) | 88 (8.7%) | 0.271 | |||||||||||||||||||||||||||||||||||||||||||||||||||||||||||||||||||||||||||||||||||||||||||||||
| Solid neoplasms | 299 (8.9%) | 217 (9.2%) | 82 (8.1%) | 0.308 | |||||||||||||||||||||||||||||||||||||||||||||||||||||||||||||||||||||||||||||||||||||||||||||||
| Cognitive and physical function | |||||||||||||||||||||||||||||||||||||||||||||||||||||||||||||||||||||||||||||||||||||||||||||||||||
| Walking speed ≤ 0.8 m/s | 834 (26.9%) | 592 (27.3%) | 242 (25.9%) | 0.447 | |||||||||||||||||||||||||||||||||||||||||||||||||||||||||||||||||||||||||||||||||||||||||||||||
| ≥1 ADL impaired | 327 (9.7%) | 232 (9.9%) | 95 (9.4%) | 0.693 | |||||||||||||||||||||||||||||||||||||||||||||||||||||||||||||||||||||||||||||||||||||||||||||||
| ≥1 IADL impaired | 3195 (95%) | 2241 (95.2%) | 954 (94.5%) | 0.427 | |||||||||||||||||||||||||||||||||||||||||||||||||||||||||||||||||||||||||||||||||||||||||||||||
| MMSE ≤ 27 | 462 (14.7%) | 318 (14.5%) | 144 (15.0%) | 0.690 | |||||||||||||||||||||||||||||||||||||||||||||||||||||||||||||||||||||||||||||||||||||||||||||||
| Outcomes | |||||||||||||||||||||||||||||||||||||||||||||||||||||||||||||||||||||||||||||||||||||||||||||||||||
| 3-year mortality | 477 (14.2%) | 347 (14.7%) | 130 (12.9%) | 0.157 | |||||||||||||||||||||||||||||||||||||||||||||||||||||||||||||||||||||||||||||||||||||||||||||||
| 6-year mortality | 927 (27.6%) | 661 (28.1%) | 266 (26.4%) | 0.307 | |||||||||||||||||||||||||||||||||||||||||||||||||||||||||||||||||||||||||||||||||||||||||||||||
| Abbreviations: SD = standard deviation; COPD = Chronic Obstructive Pulmonary Disease; m/s = meters per second; ADL = Activities of Daily Living; IADL = Instrumental Activities of Daily Living; MMSE = Mini Mental State Examination. | |||||||||||||||||||||||||||||||||||||||||||||||||||||||||||||||||||||||||||||||||||||||||||||||||||
| Missing data: 329 for BMI, 258 for walking speed, 213 for MMSE. | |||||||||||||||||||||||||||||||||||||||||||||||||||||||||||||||||||||||||||||||||||||||||||||||||||
We applied the genetic algorithm in a random sample of our data (i.e. training sample, 70%, N = 2354). The resulting FI was described and compared with a clinical FI in the remaining 30% (i.e. test sample, N = 1009) (Supplementary Table 1). From the test sample, 163 (16.1%) participants died during the first three years and almost 30% (N = 297) during the first six years (Table 1). We ran the genetic algorithm (Figure 1A) in the training sample 10 times, obtaining 10 near-optimal FIs. On average, it took 59 iterations (range 45-63) to reach convergence (i.e. a point beyond which the algorithm is unlikely to find better solutions). The resulting FIs showed similar discriminant capacity (average AUC in the training sample = 0.854; SD = 0.02) and low overfitting (range of differences in AUC when applied to test sample: -0.05 to +0.04).
Characteristics of the near-optimal frailty index
The FI showing the highest accuracy in the training sample across the whole population and in the different subsamples was chosen for the analyses on the test sample. The best genetic algorithm-derived FI (ga-FI) was obtained after 63 iterations (Figure 1B) and included 40 deficits (Supplementary Table 3) that explore different domains of health. Nineteen were chronic diseases; 13 referred to function and physical performance measures; four were related to socio-economic status; one was a measure of cognitive performance (i.e. Mini Mental State Examination); one was a self-reported problem (i.e. loss of appetite); one was a sign (i.e. abnormal patellar reflex); and one was a measure of healthcare utilization (i.e. at least one hospitalization in the previous year). In the test sample, the ga-FI had 17 missing values (2%). The ga-FI exhibited a γ-distribution (Figure 1C) and a maximum value lower than 0.70 (i.e. 0.60); both these characteristics have been reported in the literature as depicting reliable FIs [7, 26, 30, 31]. The skewness of the distribution resulted more positive in participants <78 years old and more negative in the oldest group. No distribution differences arose between males and females.
Performance of the derived frailty index
The ga-FI exhibited AUCs consistently higher than 0.80 across the whole test sample and its age and sex subsamples, both for 3-year and 6-year mortality prediction. Namely, the AUC for 3-year and 6-year mortality was 0.88 (95% confidence interval [CI] 0.85-0.91) and 0.88 (95% CI 0.86-0.91), respectively (Figure 2 and Supplementary Table 2). When applied to the subsamples, the ga-FI AUCs ranged from 0.81 (3-year mortality, older individuals) to 0.90 (3-year mortality, male sex). In a multivariate logistic regression adjusted by age, sex, cognitive status, and walking speed < 0.8 m/s, each increase by 0.1 in the ga-FI resulted in a 3-year mortality odds ratio of 2.17 (95% CI 1.54-3.04) and in a 6-year mortality odds ratio of 3.88 (95% CI 2.63-5.74). Comparing the ga-FI with a FI we had previously built on the basis of our clinical expertise (c-FI), which included 45 deficits [17], we found that only about half (N = 24) of the deficits were shared by the two indices (Supplementary Table 3). As depicted in Figures 2 and 3, in the test sample, the ga-FI showed higher areas under the curve (AUCs) in the prediction of mortality in the whole population and in all subsamples, when compared with the c-FI. Differences between the AUCs exhibited by the ga-FI and c-FI did not reach statistical significance only in the younger and older subsamples for 3-year mortality (Supplementary Table 2).
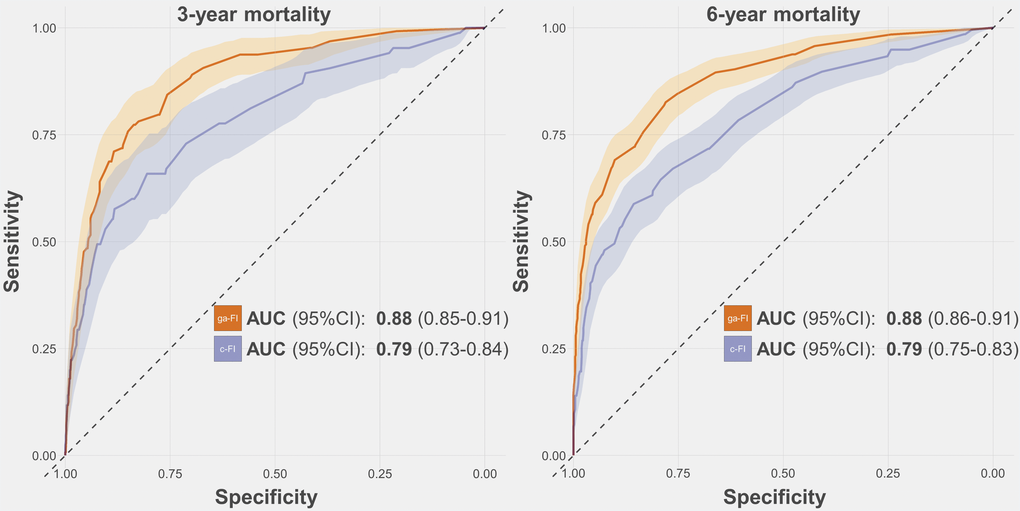
Figure 2. Receiver-Operating-Characteristics Curve and Areas Under the Curve (AUC) for the prediction of 3-year and 6-year mortality obtained for the ga-FI and c-FI in the test sample. Abbreviations: 95% CI = 95% confidence intervals; ga-FI = best genetic algorithm-derived Frailty Index; c-FI = clinically generated Frailty Index.
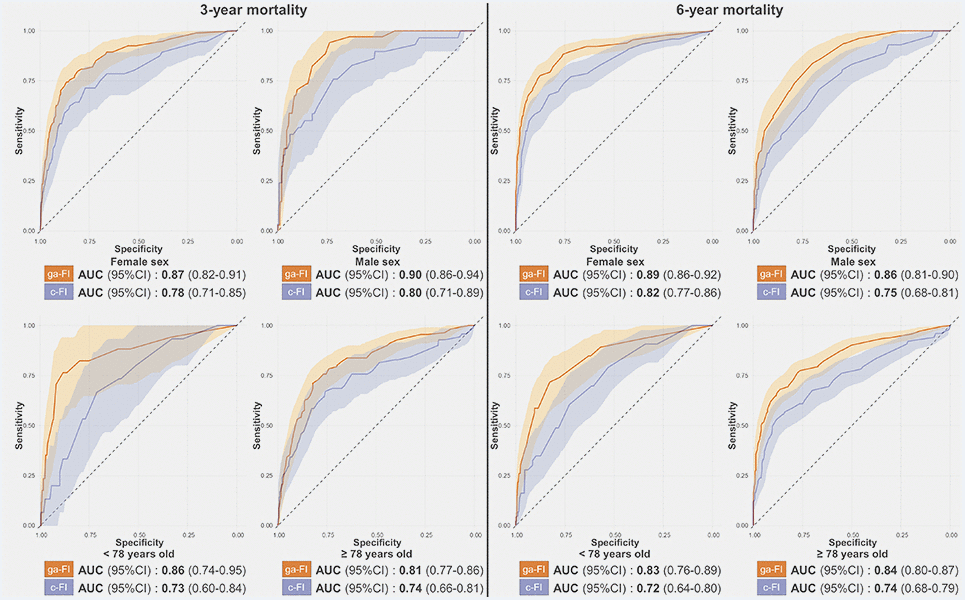
Figure 3. Receiver-Operating-Characteristics Curve and Areas Under the Curve (AUC) for the prediction of 3-year and 6-year mortality obtained for the ga-FI and c-FI in the test sample, in different subsamples. Abbreviations: 95% CI = 95% confidence intervals; ga-FI = best genetic algorithm-derived Frailty Index; c-FI = clinically generated Frailty Index.
Simulation study of randomly generated frailty indices
As shown in Figure 4A, almost all the best FIs from each iteration over ten runs of the genetic algorithm included 40 deficits. In order to investigate the meaning of such a finding, we randomly generated 100 FIs that included 40 deficits, and compared their AUCs with the ga-FI. As shown in Figure 4B, none of the randomly generated FIs reached the same predictive accuracy of the ga-FI. Finally, upon generating about 2000 random FIs that included between 25 and 108 deficits, none of them presented with an AUC as high as that of the ga-FI (Figure 4C).
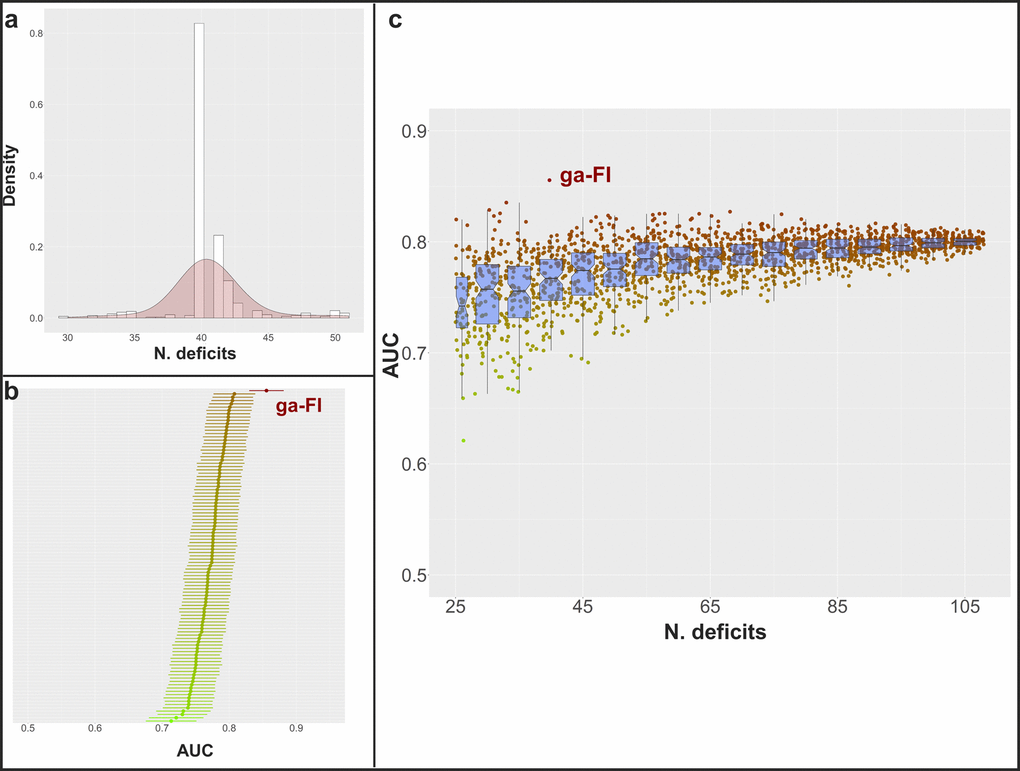
Figure 4. (A) Distribution of the number of selected deficits for the best FIs in each iteration among the 10 genetic algorithm cycles; (B) mean AUC and 95% confidence intervals in the prediction of 3-year and 6-year mortality in the whole population and in sex- and age subgroups (calculated in the complete dataset) for 100 randomly generated FIs including 40 deficits (mean AUC for ga-FI, calculated in the complete dataset, shown in red); (C) mean AUC in the prediction of 3-year and 6-year mortality in the whole population and in sex- and age subgroups (calculated in the complete dataset) for more than 2000 randomly generated FIs including 25-108 deficits (mean AUC for ga-FI, calculated in the complete dataset, shown in red) – boxplots show median and 2nd and 3rd quartiles of mean AUC for FIs with similar number of deficits.
Discussion
In the present study, we showed that an optimization algorithm can be used to guide the selection into which and how many deficits are to be included in a highly performant FI. To the best of our knowledge, this is the first time robust and standardized optimization methodology has been employed for this purpose. The adoption of the genetic algorithm led to a FI exhibiting AUCs higher than most of those reported in previous literature for the prediction of mortality, stable across different age and sex subgroups, and both in the short and long term [25, 32–34].
In recent decades, several authors adopted the FI as a tool to quantify the risk of developing poor, health-related outcomes in different settings and among persons affected by different diseases. Such proliferation may be explained by the fact that several studies showed that once a minimum number of deficits has been included in a FI, it is strongly associated with poor outcomes, irrespective of the list of variables included [5, 8, 26, 35]. Our findings confirm that the strong relationship between deficit accumulation (operationalized as a FI) and survival tolerates a considerable heterogeneity in the group of variables taken into consideration. Nevertheless, our study shows that the quantitative and qualitative aspects of deficit selection significantly impact the discriminative performance of the resulting FI.
How many deficits?
The inclusion of a minimum of 30-40 deficits has been recommended to obtain a reliable FI. However, it has been suggested that a higher number of variables may improve the precision of a FI’s estimates [26]. While aiming for an accurate FI, we found that the genetic algorithm included 40 deficits in the fittest FI in our dataset, and that FIs including more or less deficits had a higher probability to be discarded by the genetic algorithm. Indeed, almost all the best FIs (in each iteration over ten runs of the genetic algorithm) included 40 deficits, even if no limitations in the number of deficits (after the first iteration) were introduced. However, upon generating 2000 random FIs, which included between 25 and 108 deficits, we observed that the median AUC increased up to within 65-70 deficits, and then plateaued. Arguably, the inclusion of too few variables may lead to a less precise FI, more sensible to missing values. At the same time, our simulation suggests that the inclusion of too many deficits would not translate into a higher discriminant capacity; indeed, this is likely to generate statistical noise, limiting the further improvement of the FI. Lin S. and colleagues [34] showed that a 139-deficit and a 35-deficit FI exhibited similar AUCs in the prediction of mortality. Interestingly, the 35 deficits were identified using an information reduction technique, i.e. exploratory factor analysis. Furthermore, in a recent study based on data from the European Prospective Investigation into Cancer and Nutrition (EPIC) [36], a multi-collinearity analysis allowed the authors to discard seven deficits that probably did not add any information to a 39-deficit FI. Yet, we cannot conclude that there is an optimal number of deficits to be included in a FI in absolute terms. Rather, it is likely there is an optimal number of deficits to build a FI for each given population with a given assortment of potential deficits. Furthermore, our findings suggest that the selection of deficits is particularly important when the total number of deficits included is low. This is evident from the scattered AUCs from randomly generated FIs with a low number of deficits. In this regard, the genetic algorithm represents promising methodology for the creation of highly-performing FIs in different settings and datasets, without a-priori knowledge about the optimal number of deficits to be included.
Which deficits?
Clinicians and researchers build their FIs selecting the deficits on the basis of their clinical experience, relying on the recommendations provided by Searle SD et al. [26] In accordance with these recommendations, a deficit should 1) be associated with health status, 2) have a prevalence that generally increases with age, and 3) not saturate too early with age. Moreover, the complete list of deficits should cover different domains of health. Our genetic algorithm was implemented to be blinded to these recommendations and to deficit distribution in the population. Thirty-seven out of the 40 deficits included in the ga-FI were fully compliant with the aforementioned recommendations, while three deficits presented a similar prevalence among younger and older individuals. Among the 109 deficits we selected to run the genetic algorithm, 80% (N = 87) presented a prevalence among older individuals higher than that exhibited among younger ones, and none exhibited a risk of premature saturation; all these deficits could, in theory, be included in the resulting FI. However, the ga-FI included only 40 deficits and, interestingly, the genetic algorithm excluded several deficits exhibiting well-known associations with aging, mortality, and frailty (such as ischaemic heart disease, thyroid diseases, osteoporosis, diabetes, chronic kidney disease, hypertension, self-reported low quality of life, some self-reported symptoms, etc.). These deficits are typically included in the FIs proposed in the literature [7, 10, 17, 18, 25, 36]. In spite of such exclusions, the ga-FI showed a higher AUC (0.88 in the whole sample) for mortality than those reported in the literature (ranging between 0.64 and 0.80 [25, 32–34, 37]), and a stronger association with mortality than those reported in a recent meta-analysis [10]. Indeed, the odds ratios per 0.1 FI increase from the meta-analysis range, between 1.05 and 1.73, whereas the corresponding figure for our ga-FI was 3.88. It is likely that, as reported in the previous paragraph, different deficits convey similar information to the FI, and their indiscriminate inclusion increases statistical noise. For example, although ischaemic heart disease was excluded from the ga-FI, heart failure (a common consequence of myocardial infraction) was included; although heart failure is less prevalent than myocardial infarction (Supplementary Table 3), its association with mortality is stronger (data not shown). While minimizing the number of deficits, the genetic algorithm maximizes the information included in a FI, which is likely to increase the FI’s discriminant capacity in mortality prediction.
The lowest difference in the AUCs between the ga-FI and the c-FI was found in the prediction of 3-year mortality among older individuals, where 24 deficits were shared between these two FIs. These findings corroborate the idea that the clinical selection of deficits may lead to the construction of an accurate FI in specific subsamples. However, the genetic algorithm provided a FI characterized by a consistently higher discriminative capacity in different subsamples using the same 40 deficits.
Strengths and limitations
Box 1 shows the main advantages offered by the implementation of a genetic algorithm in the construction of a FI. Genetic algorithms can be highly personalized according to researchers’ or clinicians’ aims and needs—both the characteristics of the generated FI and the fitness criteria can be adapted to the goals of the users developing it (see methods for further details). Genetic algorithms were first proposed several decades ago [28] and are still commonly used due to the convenience of their adoption [38–42]. Several papers are available for researchers and physicians to understand the limits, possibilities and methodology used in genetic algorithms [43, 44]. Indeed, genetic algorithms may be implemented in different settings, using commonly employed statistical software. Furthermore, genetic algorithms, although strongly related to random numbers (see methods for further details), propose solutions according to user pre-defined criteria. Researchers can still infer about the resulting solutions—this is not always possible using high accuracy “black-box” methods (such as neural networks) [45]. In spite of these advantages, the use of the genetic algorithm in our study should be understood, bearing certain limitations in mind. Firstly, genetic algorithms (as other algorithms) tend to overfit. We limited overfitting by employing two separate subsamples (a training and test sample), and we presented the results through bootstrapping techniques. Nevertheless further studies are needed to inspect the predictive accuracy of the ga-FI in different datasets, such as follow-up waves of SNAC-K. Secondly, we tested the genetic algorithm for the computation of an optimized FI using only SNAC-K data. These data are gathered through a set of interviews, tests and examinations performed by trained nurses, physicians and neuropsychologists, which guarantees more exhaustive and comprehensive data collection compared to automatically generated administrative data. Further studies are needed to understand the optimization power a genetic algorithm has on data coming from different settings. Lastly, it is possible that the parameters presented in this paper (such as initial population size, mutation probability, elitism—see methods for details) allowed us to obtain a good accuracy-to-computing speed ratio in SNAC-K, but may require further testing in other datasets.
Relevance and future applications
In this study, we showed that a genetic algorithm may be helpful in selecting those deficits responsible for an optimal predictive capacity, whether it is in the general population or in specific subsamples. The genetic algorithm might be used to minimize the number of deficits needed to obtain a reliable FI in different subsamples; this may strongly contribute to cost reductions when a FI is used to stratify risk in a large population, for example. Genetic algorithms can be personalized with different fitness functions; in other words, it would be possible to select other outcomes (such as hospitalizations, healthcare resource use, falls, etc.) to adapt the FI to their prediction. Furthermore, the genetic algorithm could be used to create a highly accurate FI in a particular subsample, for example, patients undergoing specific surgical procedures or groups affected by the same index disease (e.g. HIV). Additionally, the metrics used to assess fitness can also be modified—a FI with higher sensitivity might be used for screening purposes, for example. Genetic algorithms are well known algorithms, although seldom used in medical research. In consideration of the increasing number of available large databases [46], these algorithms might help to select features of interest without having to rely on black-box methodologies [45]. Interestingly, a previous study [47] showed how non-linear modelling (obtained using machine learning techniques) may help to increase the accuracy in the prediction of mortality, compared to the simple deficit ratio calculation. To note, the genetic algorithm may be employed to find the most suitable weights for the deficits to be included in a non-linear form of FI, in order to increase its accuracy.
Conclusions
The frailty index is a recognized clinically relevant tool to support medical decisions in the treatment and care of older adults. In this study, we present the implementation of an algorithm that allows to overcome the limitations posed by feature selection, based mostly on clinicians’ expertise, which may lead to wrong or biased results. We show that the genetic algorithm generates a FI with a consistently high accuracy in the prediction of mortality in different subsamples, obtaining higher AUCs than the ones exhibited by a FI whose deficits were selected based on our own expertise. This methodology represents a promising opportunity to optimize the exploitation of clinical and administrative databases in the construction of highly performant frailty indices.
Box 1.
Advantages offered by the genetic algorithm in the optimization of a frailty index.
Genetic algorithms’ strength-points:
Is user-focused: the main characteristics of candidate solutions can be specified by the user.
Is goal-directed: the definition of “goodness” of a solution is defined by the user.
Is data-driven: it might be used where clinical experience is insufficient but data are available.
Is transparent: although largely based on random numbers, the selection of solutions is user-determined. In contrast with black-box methods (as most machine-learning algorithms), inference about the selected solution is possible.
Materials and Methods
Study population
Data were obtained from the Swedish National Study on Aging and Care in Kungsholmen (SNAC-K), an ongoing population-based study started in 2001. Persons aged at least 60 years old and living in a central area of Stockholm (Sweden), either at home or in institutions, were asked to participate in the study. Standard questionnaires, interviews, medical examinations, instrumental evaluations, as well as physical and neuropsychological tests were employed to retrieve information for the 3363 individuals enrolled in the study. Further details are available in a previous study [48]. The Regional Ethical Review Board of Stockholm approved every phase of SNAC-K. Each participant, or their proxies in case of cognitive decline, signed a written informed consent form. The study population was randomly split into two samples: 70% (N = 2354) was used to run the algorithm (i.e. training sample), while the remaining 30% (N = 1009) was employed to describe the resulting FI and for the comparison with a clinical FI (i.e. test sample).
Identification of potential deficits
A variable was considered to be a potential deficit if it was likely associated with individuals’ health status. For the aim of the present study, we decided not to limit the selection of potential deficits to those whose prevalence grew with age, as suggested by Searle SD [26]. Our hypothesis was in fact that deficits whose prevalence varied with age (i.e. increasing, with bimodal pattern, or even decreasing) may be able to add meaningful information regarding health. We identified a total of 109 potential deficits; these variables were re-codified into dichotomous deficits in order to be suitable for FI creation [49]. Cut-offs used for dichotomization were based on the literature and are shown in Supplementary Table 3. The total number of possible FIs (including between 30 and 70 deficits and based on 109 variables identified) was higher than 6.4×1032.
The genetic algorithm
A genetic algorithm starts from a limited number of randomly generated solutions and applies a selective pressure. Solutions more adherent to pre-defined criteria (i.e. the fittest individuals) have higher chances to be combined with each other, generating new solutions. These newly generated solutions (i.e. children solutions), likely incorporating parents’ characteristics responsible for the increased fitness, replace the less fit solutions from the previous iteration. Iteration by iteration, the algorithm produces solutions that are increasingly adherent to the pre-defined criteria set by the investigators.
Figure 1A illustrates the six phases coded in our genetic algorithm.
Creation of the initial set of solutions: in this phase, the genetic algorithm randomly creates a set of solutions (initial population, in genetic algorithm terminology). These solutions represent the starting point used by the genetic algorithm to search (and create) more fit solutions to the problem. Our genetic algorithm created 1100 FIs. We set the initial number of FI to 10 times the number of potential deficits. After different trials, we found that this number offered a good balance between late convergence and time of execution. Each potential deficit had a uniform probability to be included (or excluded) from each FI. Each randomly created FI was represented by a vector (chromosome in genetic algorithm terminology) with dimension 109 (total number of potential deficits found in SNAC-K): a 1 or 0 (allele in genetic algorithm terminology) was recorded for each vector component, according to the status of the deficit (included or excluded, respectively). In this phase, the number of deficits included (i.e. the number of “1”s recorded) in each FI ranged between 30 and 70. To note, we did not introduce any constraints on the number of deficits to be considered in the next phases of the algorithm. A FI was built from each vector; the sum of the deficits included was divided by the total number of non-missing deficits taken into consideration. If the number of missing deficits exceeded 10% of those included in the FI, a missing value for the FI was registered. If the total number of missing values for the FI was higher than 177 (7.5% of the training sample), the FI was excluded.
Fitness evaluation: in this phase, the genetic algorithm assesses the fitness of each solution according to the definition of goodness set by the developing team. Our genetic algorithm was coded to find the most accurate FI for the prediction of mortality in the whole study population and different subsamples. The accuracy was assessed calculating the mathematical mean between the Areas Under the Receiver-Operating-Characteristic (AUC) in the prediction of 3-year and 6-year mortality, exhibited in the whole study sample and in four subsamples (i.e. males and females, individuals younger and older than 78 years—the median age in SNAC-K). The AUCs were obtained from non-parametric ROC analysis.
Selection: in this phase, the genetic algorithm selects the parent solutions (i.e. the fittest solutions out of the 1100) to be re-combined in new solutions, likely increasing the general fitness of the population of solutions. We employed a proportionate fitness selection operator for this. Shortly, the probability of selection for each FI was obtained according to the following formula:
where i is the considered FI and
is the mean AUC obtained in the fitness evaluation phase. This method allows the increase of the probability in selecting the most accurate FIs (although it is never equal to 1—they are not necessarily selected) and to decrease the probability in selecting those FIs with a lower accuracy (although it is never equal to 0—they are not necessarily excluded). This method is also known as “roulette wheel selection”. Similar to the casino game, where a ball is used to determine the winning number among all possible numbers, a random probability pi is used to select candidate solutions for re-combination. The probability for a FI to be selected is proportional to its accuracy (conversely, in the casino game, the pocket in the roulette wheel in which the ball may stop is equally probable for all numbers). We obtained 1067 couples of FIs for the re-combination phase: the 33 most accurate FIs in every iteration were maintained for the subsequent iteration (elitism = 3%). There were no constraints on the number of times a FI could be selected and the same FI could also be selected for both elements of the couple (therefore, the recombination phase would not have any effect). Recombination (crossover): in this phase, the genetic algorithm re-combines the selected solutions (parents) to generate children solutions (offspring in genetic algorithm terminology). Each child solution includes sections of the parents’chromosome. In our study, two random numbers were generated for each couple of selected FIs. These numbers, called crossing-over points in genetic algorithm terminology, identified the “switching” positions in the vectors representing the FIs. A new vector (i.e. a new FI) was created by combining the components between the first component and the component identified by the first random number of the first vector, the components between the positions identified by the first and the second random numbers of the second vector, and the components between the second random number and the last component of the first vector again (Figure 1A). This procedure was repeated for all the couples selected.
Mutation: in this phase, the genetic algorithm has a low but existing probability to randomly change part of a chromosome. This phase allows the genetic algorithm to find new solutions that in theory cannot be generated starting from the initial population. On the other side, high mutationrates can possibly change solutions with high fitness. In our genetic algorithm, we established a 3% chance that a random component of a vector was changed (therefore excluding or including a random deficits).
Population replacement and termination: in this phase, the genetic algorithm replaces the solutions included in the initial population with those generated in the re-combination phase. In our genetic algorithm, re-combined FIs replaced the 97% least accurate FIs in the initial population (see point 3). The genetic algorithm ran until at least one of the following conditions was met: 1) 150 iterations were reached, or 2) the average AUC of the best FI did not show any AUC increase for seven consecutive iterations.
We run the genetic algorithm 10 times, therefore starting from 10 different initial populations, on the same training sample. The FI showing the highest average AUC most frequently across the whole population and different subsamples in the training sample was considered our best ga-FI, and was compared head-to-head with the c-FI (see below). Figure 1B summarizes the cycle that led to the best ga-FI.
The clinical Frailty Index (c-FI.)
The c-FI was created based on a previous published work [17]. It includes 45 deficits, clinically selected by two geriatricians (Supplementary Table 3). It showed AUCs similar to other well-known geriatric indicators (such as walking speed) in the prediction of mortality and hospitalizations. In the test sample, the number of missing values was 96 (9%).
Statistical analyses
Differences in the characteristics of the study population and its subsamples were described using means and standard deviations or absolute numbers and proportions and investigated using t-tests and chi-squared tests, as appropriate. The performance of the ga-FI and the comparison with the c-FI were conducted in the test sample. AUCs, their confidence intervals, and their comparison were obtained through non-parametric ROC analyses, employing stratified bootstrapping replacement technique [50] (N = 2000). Confidence intervals for specificities at given sensitivities for the ROC curves were also obtained through stratified bootstrapping replacement technique (N = 2000). Panels b and c in Figure 4 were obtained by creating FIs that randomly included a given number of deficits: their AUCs were calculated using non-parametric ROC analyses in the complete dataset. The association between the ga-FI and mortality (3-year and 6-year) was tested running logistic regressions in the test sample, adjusted for age, sex, MMSE < 27, and walking speed ≤ 0.8 m/s. An α-level of 0.05 was used for all the analyses. The genetic algorithm was coded entirely in STATA 15 (Statacorp, Texas – USA). The analyses were conducted using STATA 15 and R 3.6.1 (R Foundation for Statistical Computing, Wien – Austria) [50–52].
Ethics approval and consent to participate
Every wave of the study was approved by the Regional Ethical Review Board in Stockholm, Sweden. Written informed consent was obtained from each participant, or from a proxy, in case of cognitive impairment. Public or patients were not involved during the development of this study: anyhow, we plan to disseminate the findings of this research to participants of SNAC-K and to the public.
Availability of data and materials
Data are from the SNAC-K project, a population-based study on aging and dementia (http://www.snac-k.se/). Access to these original data is available to the research community upon approval by the SNAC-K data management and maintenance committee. Applications for accessing these data can be submitted to Maria Wahlberg (
Transparency statement
The lead author (AZ) affirm that the manuscript is an honest, accurate, and transparent account of the study being reported; that no important aspects of the study have been omitted; and that any discrepancies from the study as originally planned have been explained.
Author Contributions
Conception and design of the work: AZ, DLV. Data analysis: AZ. Interpretation of the results: all coauthors. Drafting the article: AZ, DLV. Critical revision of the manuscript: all coauthors. Final approval of the manuscript: all coauthors. All the authors fulfil the ICMJE criteria for authorship.
Acknowledgments
We thank the SNAC-K participants and the SNAC-K Group for their collaboration in data collection and management.
Conflicts of Interest
All authors declare that no organizations have attempted to influence the study or the writing of the manuscript. They have had no financial relationships in the previous three years with any organizations that might have an interest in influencing the submitted work and no other relationships or activities that could appear to have influenced the submitted work.
Funding
This work was supported by the funders of the Swedish National study on Aging and Care (SNAC): the Ministry of Health and Social Affairs, Sweden; the participating County Councils and Municipalities; and the Swedish Research Council. Specific grants were received from The Swedish Research Council for Medicine (VR; 521-2013-8676; 2017-06088; 2016-00981); the Swedish Research Council for Health, Working life and Welfare (Forte; 2016-07175; 2017-01764); and the Ermenegildo Zegna Foundation. The funders had no role in study design, data collection and analysis, decision to publish, or preparation of the manuscript.
References
- 1. Santoni G, Angleman S, Welmer AK, Mangialasche F, Marengoni A, Fratiglioni L. Age-related variation in health status after age 60. PLoS One. 2015; 10:e0120077. https://doi.org/10.1371/journal.pone.0120077 [PubMed]
- 2. Ferrucci L, Studenski S. Clinical Problems of Aging. Harrison’s Principles of Internal Medicine. USA: McGraw-Hill Education, 2016.
- 3. Mitnitski AB, Mogilner AJ, Rockwood K. Accumulation of deficits as a proxy measure of aging. ScientificWorldJournal. 2001; 1:323–36. https://doi.org/10.1100/tsw.2001.58 [PubMed]
- 4. Ferrucci L, Levine ME, Kuo PL, Simonsick EM. Time and the Metrics of Aging. Circ Res. 2018; 123:740–44. https://doi.org/10.1161/CIRCRESAHA.118.312816 [PubMed]
- 5. Clegg A, Young J, Iliffe S, Rikkert MO, Rockwood K. Frailty in elderly people. Lancet. 2013; 381:752–62. https://doi.org/10.1016/S0140-6736(12)62167-9 [PubMed]
- 6. Morley JE, Vellas B, van Kan GA, Anker SD, Bauer JM, Bernabei R, Cesari M, Chumlea WC, Doehner W, Evans J, Fried LP, Guralnik JM, Katz PR, et al. Frailty consensus: a call to action. J Am Med Dir Assoc. 2013; 14:392–97. https://doi.org/10.1016/j.jamda.2013.03.022 [PubMed]
- 7. Rockwood K, Song X, MacKnight C, Bergman H, Hogan DB, McDowell I, Mitnitski A. A global clinical measure of fitness and frailty in elderly people. CMAJ. 2005; 173:489–95. https://doi.org/10.1503/cmaj.050051 [PubMed]
- 8. Rockwood K, Mitnitski A. Frailty defined by deficit accumulation and geriatric medicine defined by frailty. Clin Geriatr Med. 2011; 27:17–26. https://doi.org/10.1016/j.cger.2010.08.008 [PubMed]
- 9. Whitehead JC, Hildebrand BA, Sun M, Rockwood MR, Rose RA, Rockwood K, Howlett SE. A clinical frailty index in aging mice: comparisons with frailty index data in humans. J Gerontol A Biol Sci Med Sci. 2014; 69:621–32. https://doi.org/10.1093/gerona/glt136 [PubMed]
- 10. Kojima G, Iliffe S, Walters K. Frailty index as a predictor of mortality: a systematic review and meta-analysis. Age Ageing. 2018; 47:193–200. https://doi.org/10.1093/ageing/afx162 [PubMed]
- 11. Muscedere J, Waters B, Varambally A, Bagshaw SM, Boyd JG, Maslove D, Sibley S, Rockwood K. The impact of frailty on intensive care unit outcomes: a systematic review and meta-analysis. Intensive Care Med. 2017; 43:1105–22. https://doi.org/10.1007/s00134-017-4867-0 [PubMed]
- 12. Liu Z, Wang Q, Zhi T, Zhu Y, Wang Y, Wang Z, Shi J, Xie X, Chu X, Wang X, Jiang X. Frailty Index and Its Relation to Falls and Overnight Hospitalizations in Elderly Chinese People: A Population-based Study. J Nutr Health Aging. 2016; 20:561–68. https://doi.org/10.1007/s12603-015-0625-6 [PubMed]
- 13. Li G, Thabane L, Ioannidis G, Kennedy C, Papaioannou A, Adachi JD. Comparison between frailty index of deficit accumulation and phenotypic model to predict risk of falls: data from the global longitudinal study of osteoporosis in women (GLOW) Hamilton cohort. PLoS One. 2015; 10:e0120144. https://doi.org/10.1371/journal.pone.0120144 [PubMed]
- 14. McDonagh J, Martin L, Ferguson C, Jha SR, Macdonald PS, Davidson PM, Newton PJ. Frailty assessment instruments in heart failure: A systematic review. Eur J Cardiovasc Nurs. 2018; 17:23–35. https://doi.org/10.1177/1474515117708888 [PubMed]
- 15. Orouji Jokar T, Ibraheem K, Rhee P, Kulavatunyou N, Haider A, Phelan HA, Fain M, Mohler MJ, Joseph B. Emergency general surgery specific frailty index: A validation study. J Trauma Acute Care Surg. 2016; 81:254–60. https://doi.org/10.1097/TA.0000000000001120 [PubMed]
- 16. Ruiz J, Miller AA, Tooze JA, Crane S, Petty WJ, Gajra A, Klepin HD. Frailty assessment predicts toxicity during first cycle chemotherapy for advanced lung cancer regardless of chronologic age. J Geriatr Oncol. 2019; 10:48–54. https://doi.org/10.1016/j.jgo.2018.06.007 [PubMed]
- 17. Zucchelli A, Vetrano DL, Grande G, Calderón-Larrañaga A, Fratiglioni L, Marengoni A, Rizzuto D. Comparing the prognostic value of geriatric health indicators: a population-based study. BMC Med. 2019; 17:185. https://doi.org/10.1186/s12916-019-1418-2 [PubMed]
- 18. Williams DM, Jylhävä J, Pedersen NL, Hägg S. A Frailty Index for UK Biobank Participants. J Gerontol A Biol Sci Med Sci. 2019; 74:582–87. https://doi.org/10.1093/gerona/gly094 [PubMed]
- 19. Sohn B, Choi JW, Hwang HY, Jang MJ, Kim KH, Kim KB. Frailty Index is Associated with Adverse Outcomes after Aortic Valve Replacement in Elderly Patients. J Korean Med Sci. 2019; 34:e205. https://doi.org/10.3346/jkms.2019.34.e205 [PubMed]
- 20. Tatar C, Benlice C, Delaney CP, Holubar SD, Liska D, Steele SR, Gorgun E. Modified frailty index predicts high-risk patients for readmission after colorectal surgery for cancer. Am J Surg. 2019. [Epub ahead of print]. https://doi.org/10.1016/j.amjsurg.2019.11.016 [PubMed]
- 21. McCarthy AL, Peel NM, Gillespie KM, Berry R, Walpole E, Yates P, Hubbard RE. Validation of a frailty index in older cancer patients with solid tumours. BMC Cancer. 2018; 18:892. https://doi.org/10.1186/s12885-018-4807-6 [PubMed]
- 22. Palliyaguru DL, Moats JM, Di Germanio C, Bernier M, de Cabo R. Frailty index as a biomarker of lifespan and healthspan: focus on pharmacological interventions. Mech Ageing Dev. 2019; 180:42–48. https://doi.org/10.1016/j.mad.2019.03.005 [PubMed]
- 23. Vezza C, Vettoretti S, Caldiroli L, Bergamaschini L, Messa P, Cesari M. Use of the Frailty Index in Older Persons With Chronic Kidney Disease. J Am Med Dir Assoc. 2019; 20:1179–80. https://doi.org/10.1016/j.jamda.2019.04.015 [PubMed]
- 24. Lai JC, Covinsky KE, Dodge JL, Boscardin WJ, Segev DL, Roberts JP, Feng S. Development of a novel frailty index to predict mortality in patients with end-stage liver disease. Hepatology. 2017; 66:564–74. https://doi.org/10.1002/hep.29219 [PubMed]
- 25. Clegg A, Bates C, Young J, Ryan R, Nichols L, Ann Teale E, Mohammed MA, Parry J, Marshall T. Development and validation of an electronic frailty index using routine primary care electronic health record data. Age Ageing. 2016; 45:353–60. https://doi.org/10.1093/ageing/afw039 [PubMed]
- 26. Searle SD, Mitnitski A, Gahbauer EA, Gill TM, Rockwood K. A standard procedure for creating a frailty index. BMC Geriatr. 2008; 8:24. https://doi.org/10.1186/1471-2318-8-24 [PubMed]
- 27. Mitnitski AB, Graham JE, Mogilner AJ, Rockwood K. Frailty, fitness and late-life mortality in relation to chronological and biological age. BMC Geriatr. 2002; 2:1. https://doi.org/10.1186/1471-2318-2-1 [PubMed]
- 28. Holland JH. MIT Press ed. Complex adaptive systems. Cambridge, Mass.: MIT Press, 1992. https://doi.org/10.7551/mitpress/1090.001.0001
- 29. Winter G, Periaux J, Galan M, Cuesta P. Genetic Algorithms in Engineering and Computer Science. 1996.
- 30. Rockwood K, Mogilner A, Mitnitski A. Changes with age in the distribution of a frailty index. Mech Ageing Dev. 2004; 125:517–19. https://doi.org/10.1016/j.mad.2004.05.003 [PubMed]
- 31. Rockwood K, Blodgett JM, Theou O, Sun MH, Feridooni HA, Mitnitski A, Rose RA, Godin J, Gregson E, Howlett SE. A Frailty Index Based On Deficit Accumulation Quantifies Mortality Risk in Humans and in Mice. Sci Rep. 2017; 7:43068. https://doi.org/10.1038/srep43068 [PubMed]
- 32. Thompson MQ, Theou O, Tucker GR, Adams RJ, Visvanathan R. Recurrent Measurement of Frailty Is Important for Mortality Prediction: Findings from the North West Adelaide Health Study. J Am Geriatr Soc. 2019; 67:2311–17. https://doi.org/10.1111/jgs.16066 [PubMed]
- 33. Kim DH, Schneeweiss S, Glynn RJ, Lipsitz LA, Rockwood K, Avorn J. Measuring Frailty in Medicare Data: Development and Validation of a Claims-Based Frailty Index. J Gerontol A Biol Sci Med Sci. 2018; 73:980–87. https://doi.org/10.1093/gerona/glx229 [PubMed]
- 34. Lin SY, Lee WJ, Chou MY, Peng LN, Chiou ST, Chen LK. Frailty Index Predicts All-Cause Mortality for Middle-Aged and Older Taiwanese: Implications for Active-Aging Programs. PLoS One. 2016; 11:e0161456. https://doi.org/10.1371/journal.pone.0161456 [PubMed]
- 35. Rockwood K, Mitnitski A, Song X, Steen B, Skoog I. Long-term risks of death and institutionalization of elderly people in relation to deficit accumulation at age 70. J Am Geriatr Soc. 2006; 54:975–9. https://doi.org/10.1111/j.1532-5415.2006.00738.x [PubMed]
- 36. Lachmann R, Stelmach-Mardas M, Bergmann MM, Bernigau W, Weber D, Pischon T, Boeing H, and L.R et al. The accumulation of deficits approach to describe frailty. PLoS One. 2019; 14:e0223449. https://doi.org/10.1371/journal.pone.0223449 [PubMed]
- 37. Op Het Veld LPM, Beurskens AJHM, de Vet HCW, van Kuijk SMJ, Hajema K, Kempen GIJM, van Rossum E. The ability of four frailty screening instruments to predict mortality, hospitalization and dependency in (instrumental) activities of daily living. Eur J Ageing. 2019; 16:387–94. https://doi.org/10.1007/s10433-019-00502-4 [PubMed]
- 38. Qian L, Wang J, Jin L, Huang Y, Zhang J, Zhu H, Yan S, Wu X. Optimized Convolutional Neural Network by Genetic Algorithm for the Classification of Complex Arrhythmia. Journal of Medical Imaging and Health Informatics. 2019; 9:1905–12. https://doi.org/10.1166/jmihi.2019.2813
- 39. Bahadure NB, Ray AK, Thethi HP. Comparative Approach of MRI-Based Brain Tumor Segmentation and Classification Using Genetic Algorithm. J Digit Imaging. 2018; 31:477–89. https://doi.org/10.1007/s10278-018-0050-6 [PubMed]
- 40. Chae J, Jin Y, Sung Y, Cho K. Genetic Algorithm-Based Motion Estimation Method using Orientations and EMGs for Robot Controls. Sensors (Basel). 2018; 18:E183. https://doi.org/10.3390/s18010183 [PubMed]
- 41. Akbar S, Hayat M, Iqbal M, Jan MA. iACP-GAEnsC: evolutionary genetic algorithm based ensemble classification of anticancer peptides by utilizing hybrid feature space. Artif Intell Med. 2017; 79:62–70. https://doi.org/10.1016/j.artmed.2017.06.008 [PubMed]
- 42. Guo W, Jiang M, Li X, Ren B. Using a genetic algorithm to improve oil spill prediction. Mar Pollut Bull. 2018; 135:386–96. https://doi.org/10.1016/j.marpolbul.2018.07.026 [PubMed]
- 43. Whitley D. A genetic algorithm tutorial. Statistics and Computing. 1994; 4:65–85. https://doi.org/10.1007/BF00175354
- 44. Eiben AE, Smith JE. Introduction to evolutionary computing (Natural computing series). New York: Springer, 2003; xv, 299. https://doi.org/10.1007/978-3-662-05094-1
- 45. Watson DS, Krutzinna J, Bruce IN, Griffiths CE, McInnes IB, Barnes MR, Floridi L. Clinical applications of machine learning algorithms: beyond the black box. BMJ. 2019; 364:l886. https://doi.org/10.1136/bmj.l886 [PubMed]
- 46. Peterson ED. Machine Learning, Predictive Analytics, and Clinical Practice: Can the Past Inform the Present? JAMA. 2019; 322:2283. https://doi.org/10.1001/jama.2019.17831 [PubMed]
- 47. Song X, Mitnitski A, Cox J, Rockwood K. Comparison of machine learning techniques with classical statistical models in predicting health outcomes. Stud Health Technol Inform. 2004; 107:736–40. [PubMed]
- 48. Lagergren M, Fratiglioni L, Hallberg IR, Berglund J, Elmståhl S, Hagberg B, Holst G, Rennemark M, Sjölund BM, Thorslund M, Wiberg I, Winblad B, Wimo A. A longitudinal study integrating population, care and social services data. The Swedish National study on Aging and Care (SNAC). Aging Clin Exp Res. 2004; 16:158–68. https://doi.org/10.1007/BF03324546 [PubMed]
- 49. Peña FG, Theou O, Wallace L, Brothers TD, Gill TM, Gahbauer EA, Kirkland S, Mitnitski A, Rockwood K. Comparison of alternate scoring of variables on the performance of the frailty index. BMC Geriatr. 2014; 14:25. https://doi.org/10.1186/1471-2318-14-25 [PubMed]
- 50. Robin X, Turck N, Hainard A, Tiberti N, Lisacek F, Sanchez JC, Müller M. pROC: an open-source package for R and S+ to analyze and compare ROC curves. BMC Bioinformatics. 2011; 12:77. https://doi.org/10.1186/1471-2105-12-77 [PubMed]
- 51. Team RC. R: A Language and Environment for Statistical Computing. Vienna, Austria: R Foundation for Statistical Computing; 2019.
- 52. Wickham H. ggplot2 : elegant graphics for data analysis (Use R!). p. 212 S.