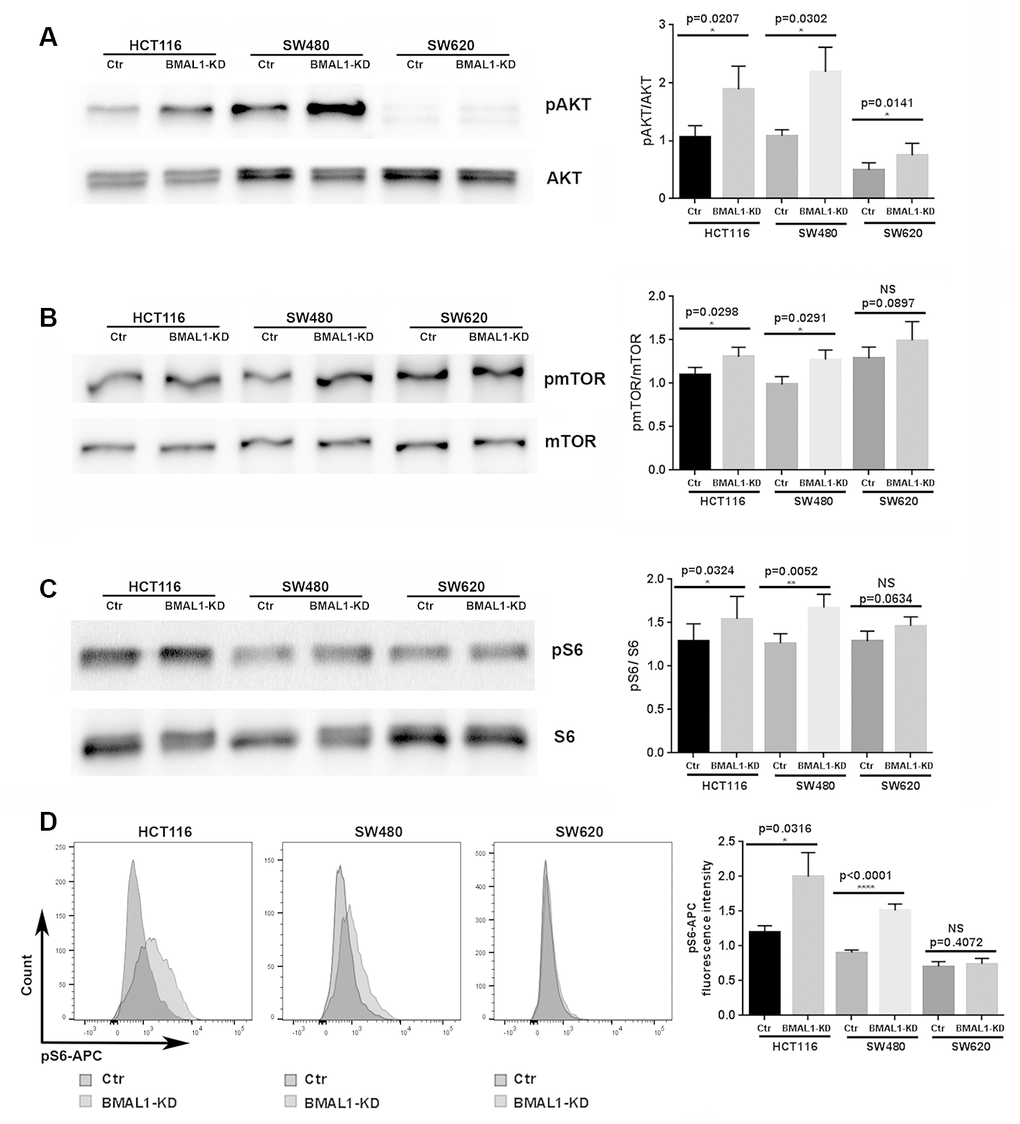
Figure 2.BMAL1-KD increased AKT/mTOR activation to varying degrees in the CRC cell lines. (A) Western-blot analysis revealed that BMAL1-KD increased AKT phosphorylation in the three CRC cell lines (n=5; *p<0.05; **p<0.01). The ratio of phosphorylated AKT to total AKT was used to indicate AKT activation level. (B) Western-blot analysis revealed that BMAL1-KD increased mTOR phosphorylation in HCT116 and SW480 (n=6; *p<0.05) but not in SW620 cells. The ratio between phosphorylated mTOR and total mTOR was used to indicate mTOR activation level. (C) Western-blot analysis revealed that knockdown BMAL1 increased 40S Ribosomal protein S6 phosphorylation in HCT116 and SW480 (n=6; ***p<0.001) but not in SW620 cells. The ratio between phosphorylated S6 and total S6 was used to evaluate mTOR activity. (A-C): Left, a representative immunoblot of independent experiments. Right, Bar charts represent the target protein expression level normalized to protein loading controls. (D) Flow cytometry analysis revealed increased phosphorylated S6 in HCT116 BMAL1-KD (*p<0.05) and SW480 BMAL1-KD (****p<0.0001) cells but not in SW620 BMAL1-KD cells compared to their proper controls. Left, representative staining of 7 independent experiments is shown. Right, Graphs represented the mean fluorescence intensity value of phosphorylated S6-APC (n=7). All data are shown as means ± SEM.