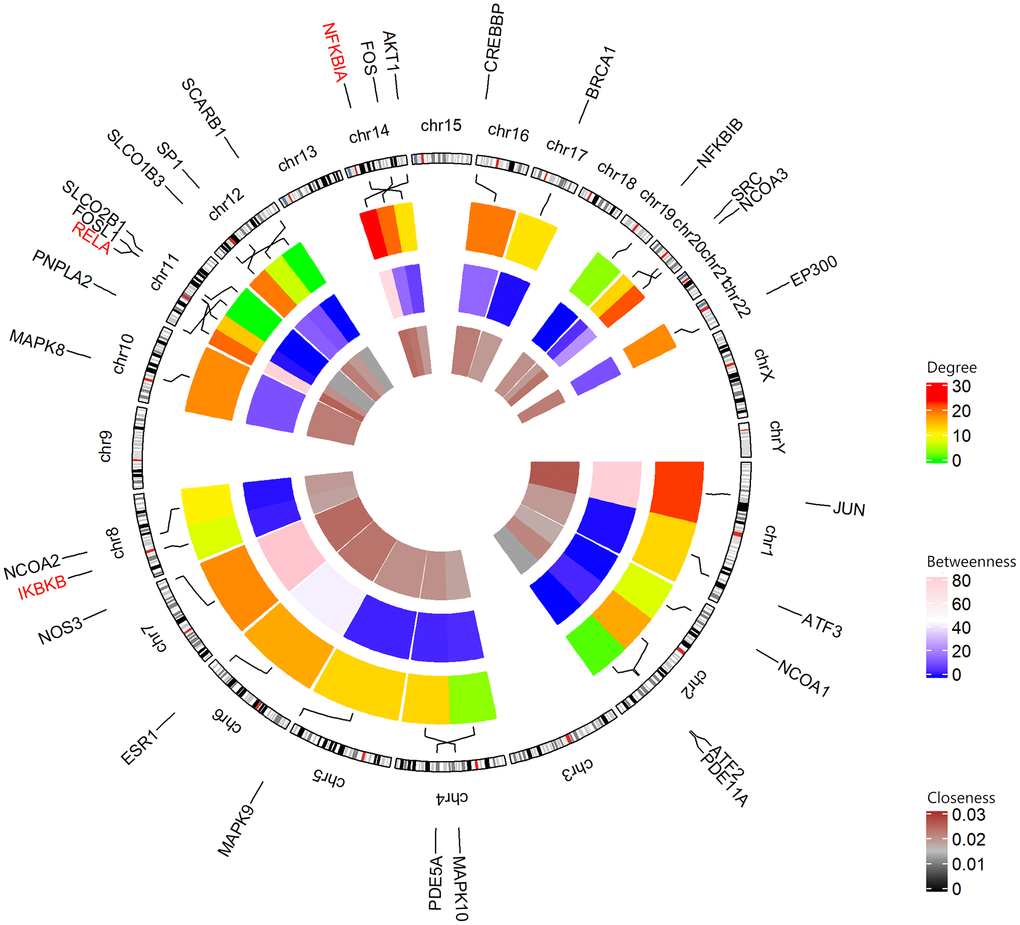
Figure 4.Circular visualization of chromosomal positions and connectivity of icariin-targeted genes. The names of the genes are shown in the outer circle. For the outer heatmap, red represents high degree, and green represents low degree. For the middle heatmap, pink represents high betweenness, and blue represents low betweenness. For the inner heatmap, brown represents high closeness, and black represents low closeness. Lines coming from each gene point to their specific chromosomal locations on the chromosomal circle. The three hub genes are shown in red.