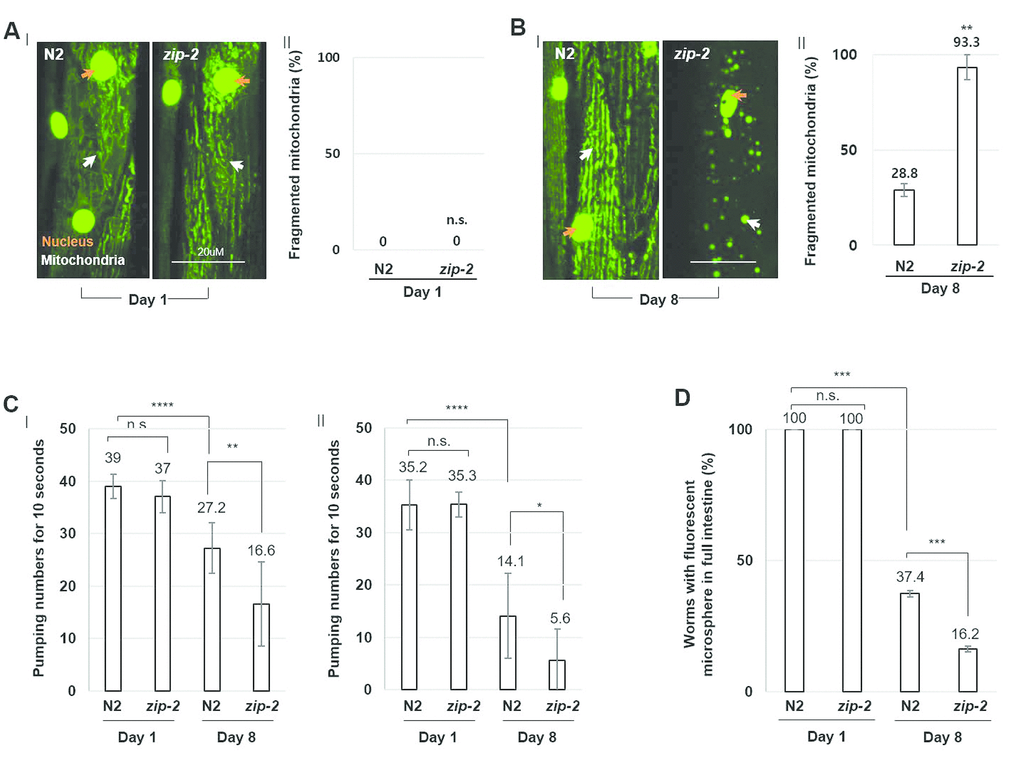
Figure 1.ZIP-2 mutation accelerates C. elegans aging. (A) (I) Representative images of mitochondrial morphologies in body wall muscle at day 1 of adulthood in wild-type (N2) (n=30) or zip-2(ok3730) mutant worms (n=30). The orange and white arrows indicate the nucleus and mitochondria of muscle cells, respectively. Scale bar: 20 μm. (II) Qualitative analysis of mitochondrial morphology observed at day 1 of adulthood in wild-type or zip-2(ok3730) mutant worms. Bars represent the proportion of worms with fragmented mitochondria. The n value represents total number of tested worms by three independent experiments. (B) (I) Representative images of mitochondrial morphologies in body wall muscle at day 8 of adulthood in wild-type (n=40) or zip-2(ok3730) mutant worms (n=35). (II) Qualitative analysis of mitochondrial morphology observed at day 8 of adulthood in wild-type or zip-2(ok3730) mutant worms. Bars represent the proportion of worms with fragmented mitochondria. The n value represents total number of tested worms by three independent experiments. (C) Pharyngeal pumping rate of 1-day wild-type (n=23), 1-day zip-2(ok3730) mutant worms (n=23), 8-day wild-type (n=18), and 8-day zip-2(ok3730) mutant worms (n=18). The n value represents total number of tested worms by two independent experiments. Error bars represent standard deviation (S.D.). (D) The proportion of worms with fluorescent microspheres in full intestine in 1-day wild-type (n=35), 1-day zip-2(ok3730) mutant worms (n=35), 8-day wild-type (n=54), and 8-day zip-2(ok3730) mutant worms (n=48). The n value represents total number of tested worms by three independent experiments. Shapiro-Wilk normality test was used to assess normal distribution of the samples. Significance was determined using a two-tailed, unpaired t-test. n.s.= not significant, ** P < 0.01, *** P < 0.001, **** P < 0.0001.