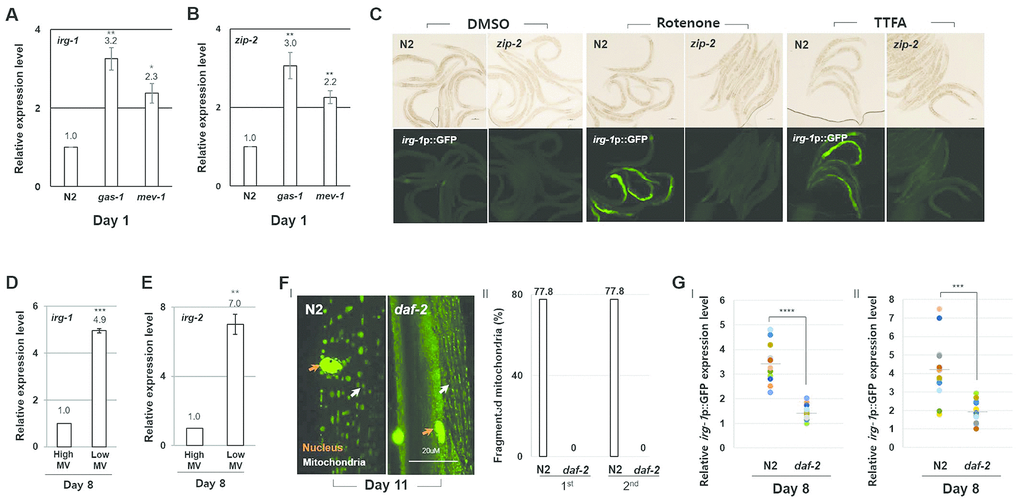
Figure 3.ZIP-2 activity increases in response to mitochondrial dysfunction. (A, B) Relative expression levels of irg-1 (A) and zip-2 (B) in wild-type (N2), gas-1(fc21) mutant, and mev-1(kn-1) mutant worms at day 1 of adulthood. (C) Representative images of irg-1p::GFP expression in DMSO, Rotenone (ETC complex I inhibitor) or TTFA (ETC complex II inhibitor) assay plates at day 1 of adulthood in wild-type or zip-2(ok3730) mutant worms. (D, E) Relative expression levels of irg-1 (D) and irg-2 (E) at day 8 of adulthood in worms with high MV or low MV. (F) (I) Representative images of mitochondrial morphologies in body wall muscle at day 11 of adulthood in wild-type strains (n=18) or daf-2(e1370) mutant strains (n=19). The orange and white arrows indicate the nucleus and mitochondria of muscle cells, respectively. Scale bar: 20 μm. (II) Qualitative analysis of mitochondrial morphology observed at day 11 of adulthood. Bars represent the proportion of worms with fragmented mitochondria. The n value represents total number of tested worms by two independent experiments. (G) Relative expression level of irg-1p::GFP in wild-type and daf-2(e1370) mutant worms at day 8 of adulthood. GFP intensity of individual worms was normalized to the minimum GFP intensity value among all GFP intensity values. Two independent experimental data. All relative expression levels were assessed by qRT-PCR, normalized to act-3. Error bars represent SEM by three independent experiments. Shapiro-Wilk normality test was used to assess normal distribution of the samples. Significance was determined using a two-tailed, unpaired t-test. * P < 0.05, ** P < 0.01, *** P < 0.001, **** P < 0.0001.