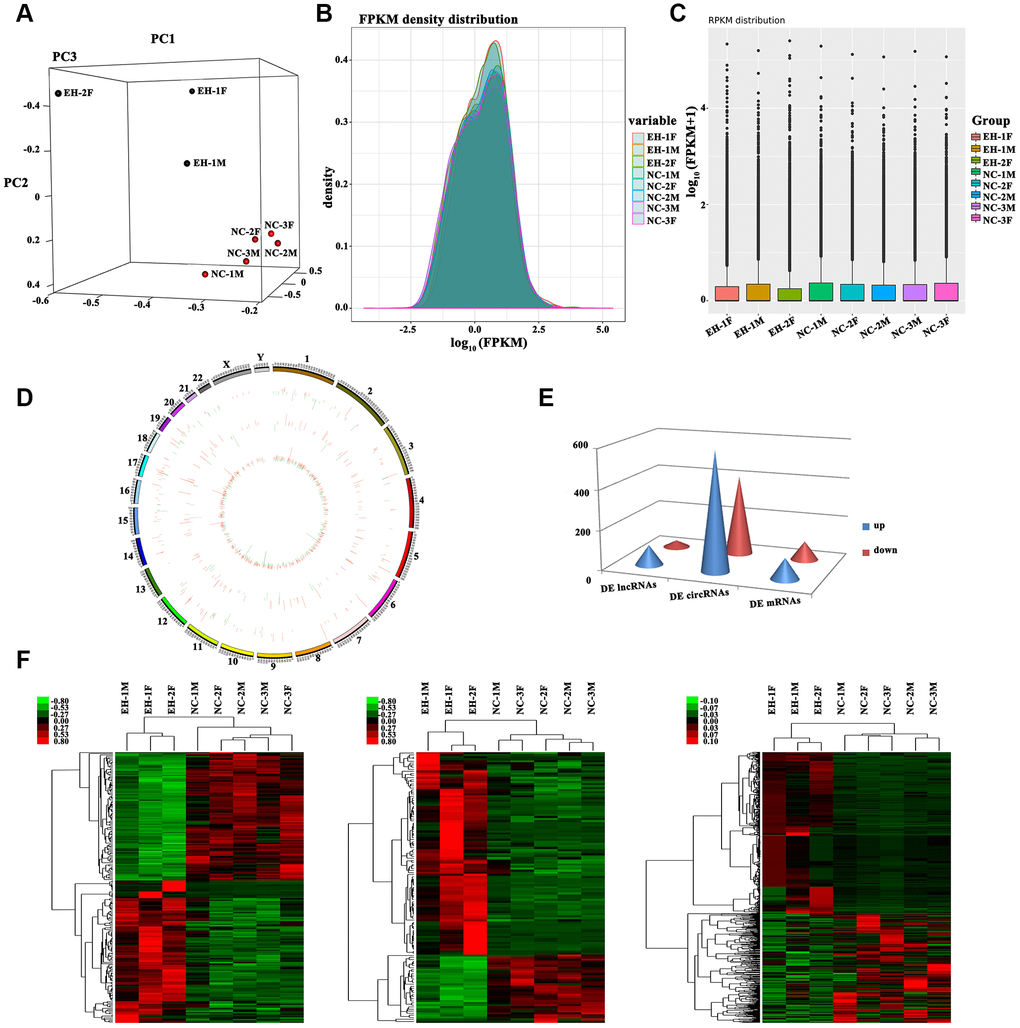
Figure 1.Profiling of differentially expressed RNAs between hypertensive subjects and normotensive controls. (A) 3D Principal Component Analysis (3D-PCA) showing the distribution of sequenced samples from hypertensive and normotensive subjects. (B) Boxplots of FPKM values (log10-scale) for different samples indicating the distribution of these values about the median. (C) FPKM density distribution for each sample. Different colors represent unique samples. (D) LncRNAs and circRNAs were broadly distributed across the 24 pairs of human chromosomes. Upregulation is indicated in red and downregulation is shown in green. Height indicates degree of difference in expression. (E) Quantification of DE lncRNAs, circRNAs, and mRNAs. (F) Heat maps based on the expression values of DE (log2 FC>1 or <-1, FDR<0.05) lncRNAs, circRNAs, and mRNAs. Expression values are represented by a color scale; red indicates high relative expression, and green indicates low relative expression. Each column represents one sample, and each row indicates a specific transcript.