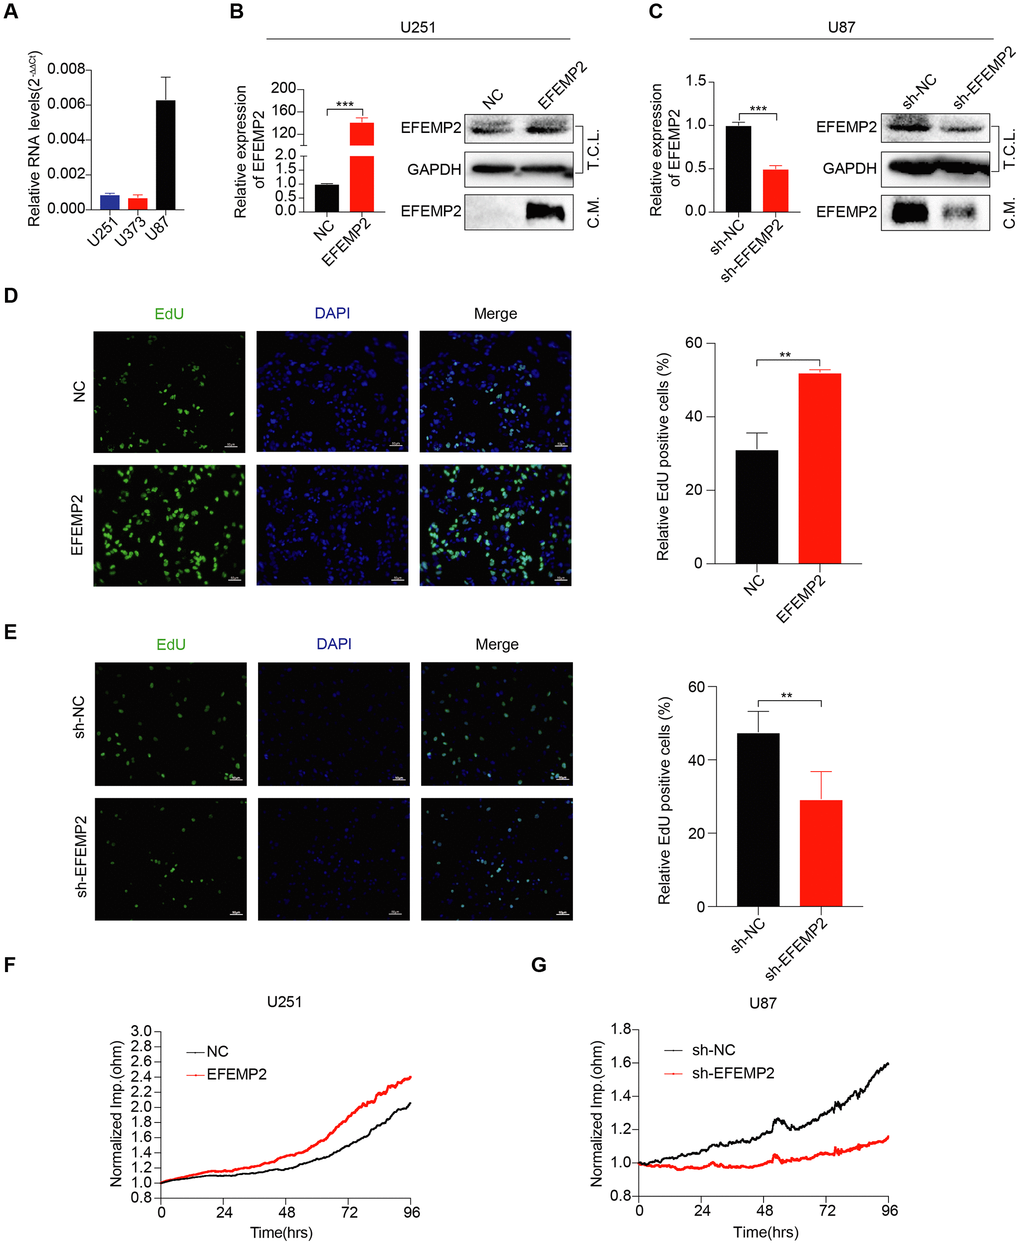
Figure 2.EFEMP2 promotes GBM cell proliferation. (A) The expression of EFEMP2 was detected in three GBM cell lines by RT-qPCR. GAPDH was used as an internal reference. (B) RT-qPCR analysis of EFEMP2 expression in U251 cells overexpressing EFEMP2. Statistical significance was assessed using two-tailed Student’s t test. ***P < 0.001 (left). Western blotting (WB) analysis of EFEMP2 protein level in total cell lysates (T.C.L.) or conditioned media (C.M.) of cells with either vector or EFEMP2 stably overexpressed (right). (C) RT-qPCR analysis of EFEMP2 expression in U87 cells knocking down EFEMP2. Statistical significance was assessed using two-tailed Student’s t test. ***P < 0.001 (left). WB analysis of EFEMP2 protein level in total cell lysates (T.C.L.) or conditioned media (C.M.) of cells with either vector or EFEMP2 stably low expressed (right). (D and E) Proliferation of stable overexpressing (D) or knockdown (E) EFEMP2 cells as measured by EdU (green) uptake. Quantification of proliferation was measured by % EdU expressing cells / total cell number. Statistical significance was assessed using two-tailed Student’s t test. **P < 0.01. Scale bar, 60 μm. (F and G) The growth of cells with stable overexpressing (F) or knockdown (G) EFEMP2 was measured by Electric Cell-substrate Impedance Sensing (ECIS).