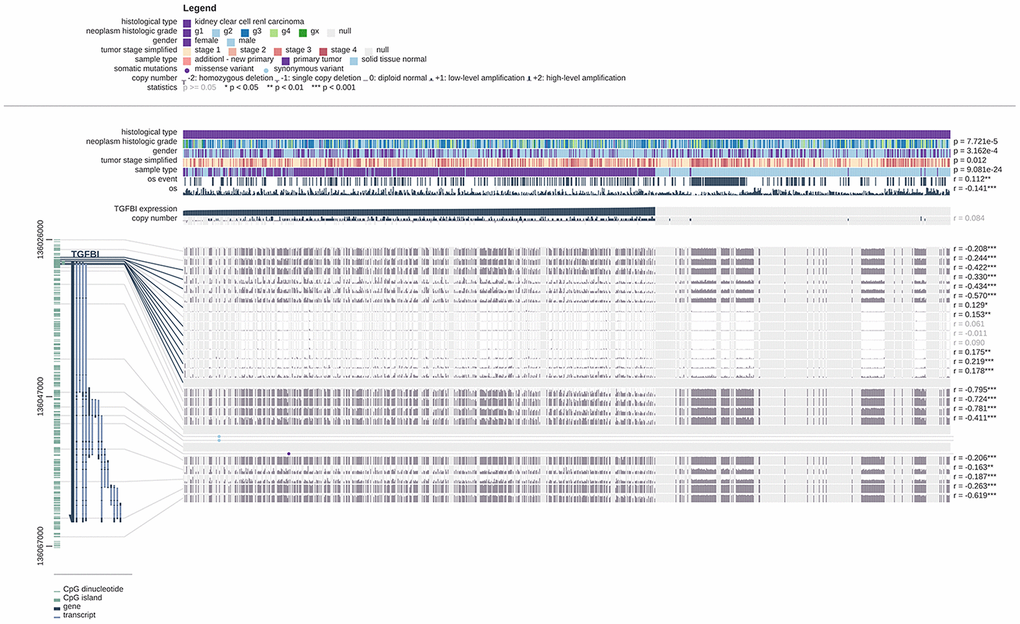
Figure 14.Visualization of the TCGA data for TGFBI in ccRCC using MEXPRESS. Samples were ordered by their expression value. This figure showed the correlation between hub gene expression and promoter methylation, with the Pearson correlation coefficients on the right (* p < 0.05, ** p < 0.01, *** p < 0.001).