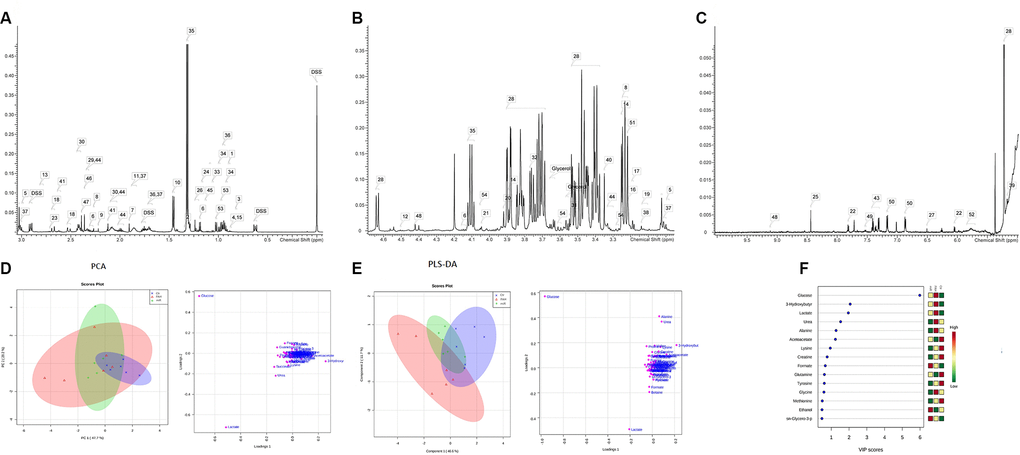
Figure 1.There are differences in metabolic patterns in the pulmonary hypertension model. Preparation of rat serum was seen in previous studies [23], and the serum were preserved in -80°C for further metabolomics analysis. Metabolite attribution spectrum of signal fragment of rat arterial blood serum samples: (A) attribution range (0.0ppm-3.0ppm interval); (B) attribution range (3.0ppm-5.0ppm interval); (C) attribution range (5.0ppm-10.0ppm interval). (Associated metabolite number identification: 1: 2-Hydroxybutyrate; 2: 2-Hydroxyisobutyrate; 3; 2-Hydroxyisovalerate; 4: 2-Hydroxyvalerate; 5: 2-Oxoglutarate; 6: 3-Hydroxybutyrate; 7: Acetate; 8: Acetoacetate; 9: Acetone; Alanine; 11: Arginine; 12: Ascorbate; 13: Aspartate; 14: Betaine; 15: Butyrate; 16: Carnitine; 17: Choline; 18: Citrate; 19: Citrulline; 20: Creatine; 21: Creatinine; 23: Dimethylamine; 24: Ethanol; 25: Formate; 26: Fucose; 27: Fumarate); 28: Glucose; 29: Glutamate; 30: Glutamine; Glycerol; 31: Glycine; 32: Guanidoacetate; 33: Isobutyrate; 34: Isoleucine 35: Lactate; 36: Leucine; 37: Lysine; 38: Malonate; 39: Mannose; 40: Methanol; 41: Methionine; 42: ethylsuccinate; 43: Phenylalanine; 44: Proline; 45: Propylene glycol; 46: Pyruvate; 47: Succinate; 48: Trigonelline; 49: Tryptophan; 50: Tyrosine; 51: sn-Glycero-3- phosphocholine; 52: Urea; 53: Valine; 54: myo-Inositol.) Changes of metabolic patterns in rats with pulmonary hypertension: (D) PCA analysis, statistical analysis was performed on rat arterial serum samples, NMR spectra were acquired, and samples were analyzed by Chenomx NMR Suite 8.0 to determine the type and concentration of metabolites in the samples. The sample data was normalized using the Pareto Scaling method, and the corresponding score map and load map were obtained by using PCA analysis. (E) PLS-DA analysis: In the PLS-DA score map, different colors represent different sample groups. It is found from the figure that the metabolic profile of the NC group samples is distinguishable from the PH group. The load map corresponding to the score map shows that the farther away the metabolites such as Glucose, Lactate, and Alanine are from the center point, the greater the contribution to the distinction between samples. (F) VIP is a sort of variable weight importance to provide the most important variables and how important they are in each group. The larger the VIP value, the greater the contribution they make in the differentiation of the sample. Generally, the variable with a default VIP greater than 1 has a significant difference.