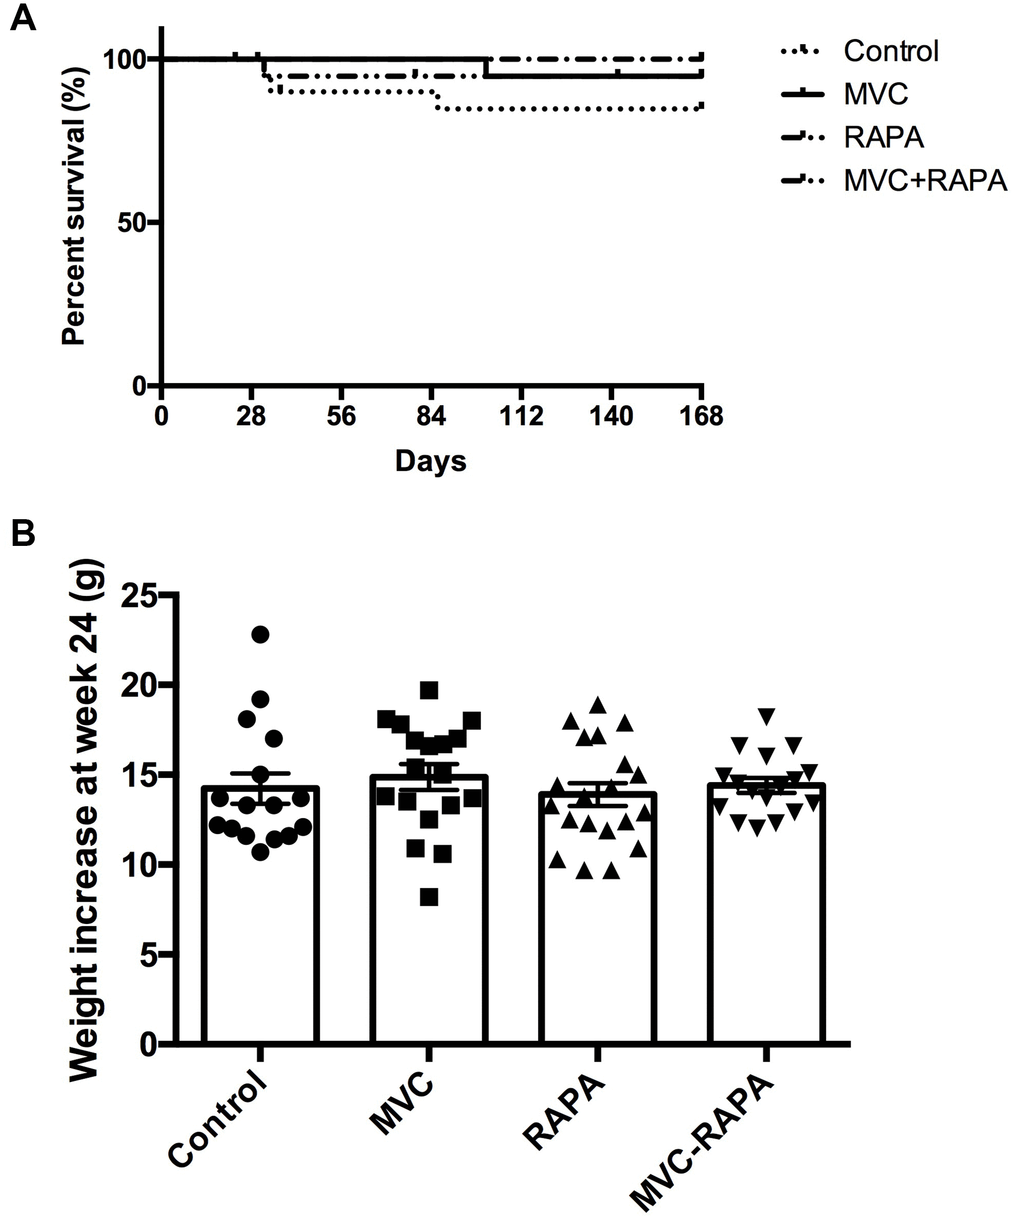
Figure 1.Survival and body weight. (A) Kaplan-Meier survival plot shows no differences. (B) Weight increase did not show statistically significant differences between groups. Each bar represents the mean ± SEM. *p <0.05 with respect to control. MVC, maraviroc. RAPA, rapamycin. MVC+RAPA, maraviroc plus rapamycin.