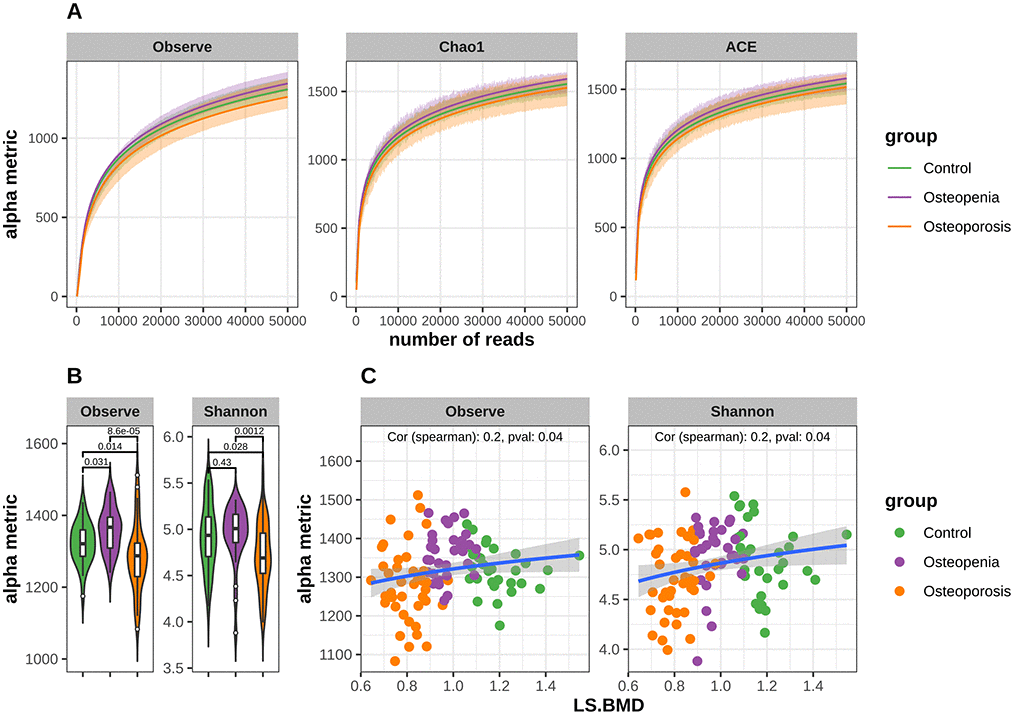
Figure 2.Decreased bacterial richness and diversity in postmenopausal osteoporosis and the alpha metrics were significant associated with LS.BMD. (A) Rarefaction curves for alpha richness in postmenopausal osteopenia, postmenopausal osteoporosis and control. The different facets show the different richness metric cures, the x-axis shows the number of reads, and the y-axis shows the richness metric. The shadow area shows standard deviation of each group. The curves in each group are near smooth when the number of reads is great enough with few OTUs undetected. (B) Comparison of α-diversity (Observe Species and Shannon) based on the OTU profile in each group. The p values are from Mann-Whitney test. (C) Correlation between bacterial diversity and LS.BMD. The x-axis shows the LS.BMD, and the y-axis shows the diversity values. The correlation is calculated with Spearman method.