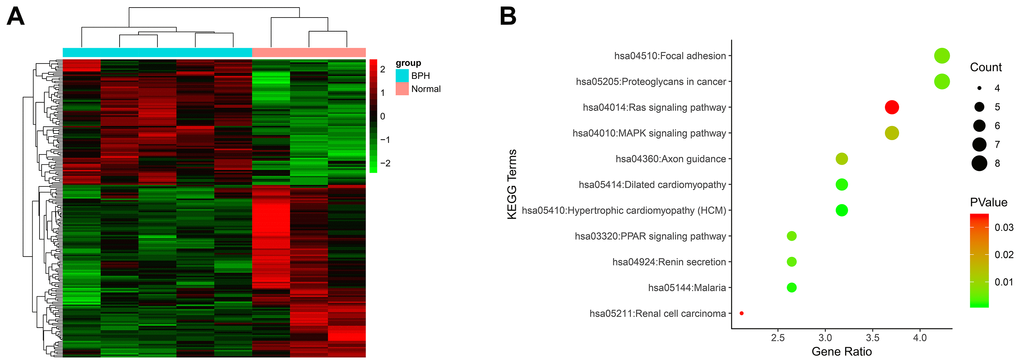
Figure 1.Microarray analysis using mRNA isolated from BPH tissues and normal tissues. (A) The heatmap plot of all 198 DEGs. The legend color bar on the right side indicates the relation between scaled expression values and colors, and the colors were balanced to ensure the black color represented zero value from comparison of five benign prostatic hyperplasia samples versus three normal prostate samples. (B) KEGG pathway analysis of 198 DEGs. The x-axis shows the number of genes and the y-axis shows the pathway terms. The negative log10 P value of each term is colored according to the legend. The count is indicated by the size of the circle.