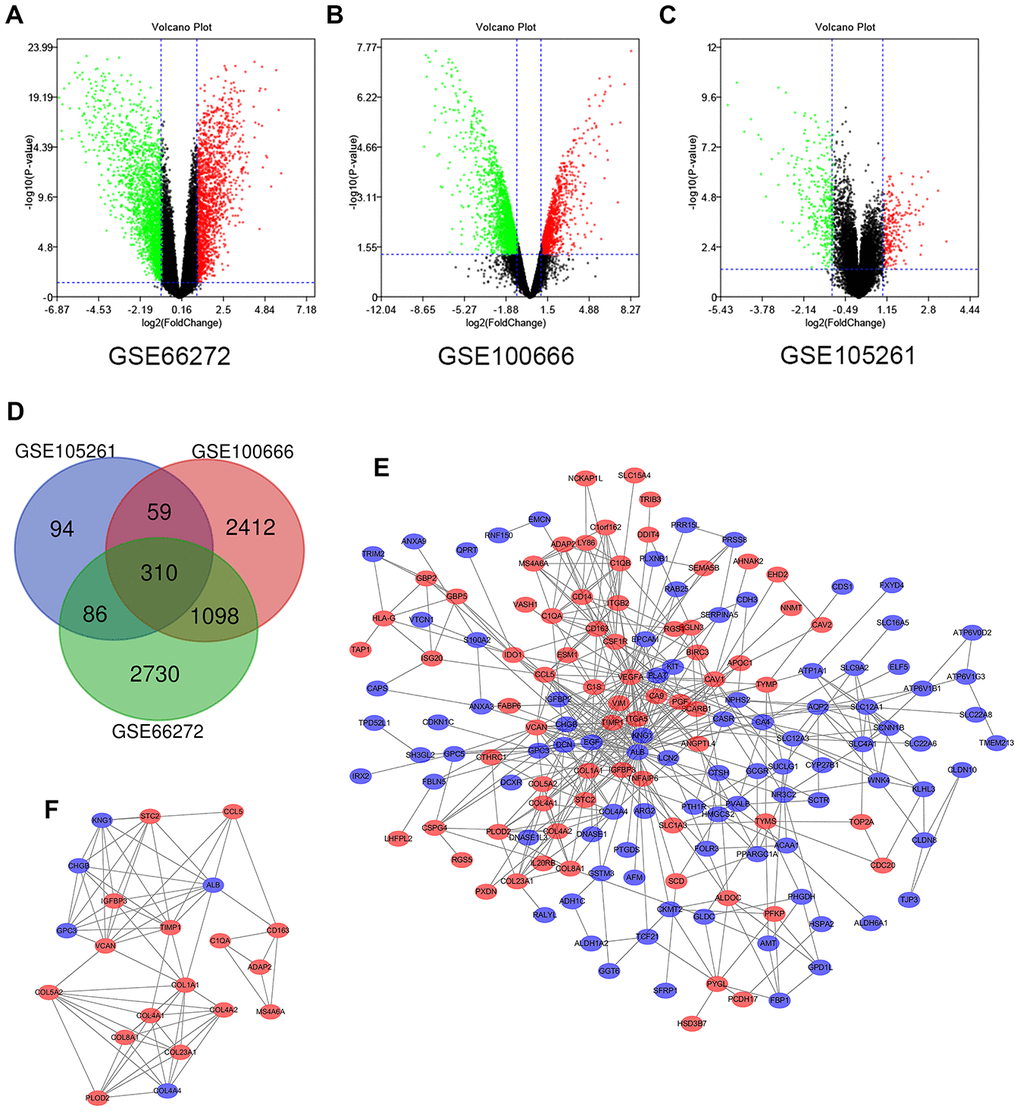
Figure 1.Differential expression of genes in the two sets of samples, Venn diagram, PPI network and the most significant DEG module. (A) GSE66272 data, (B) GSE100666 data, and (C) GSE105261 data. Red points represent upregulated genes screened on the basis of fold change > 1.0 and a corrected P-value of < 0.05. Green points represent downregulation of gene expression screened on the basis of fold change < 1.0 and a corrected P-value of < 0.05. Black points represent genes with no significant difference. (D) DEGs were selected with a |fold change| >1 and P-value <0.05 among the mRNA expression profiling sets GSE66272, GSE100666 and GSE105261. The 3 datasets exhibited an overlap of 310 genes. (E) The PPI network of DEGs was constructed using Cytoscape. (F) The most significant module was obtained from a PPI network with 21 nodes and 74 edges. Upregulated genes are marked in light red; downregulated genes are marked in light blue. Abbreviations: FC: fold change; GEO: Gene Expression Omnibus; DEGs; differentially expressed genes; PPI: protein–protein interaction.