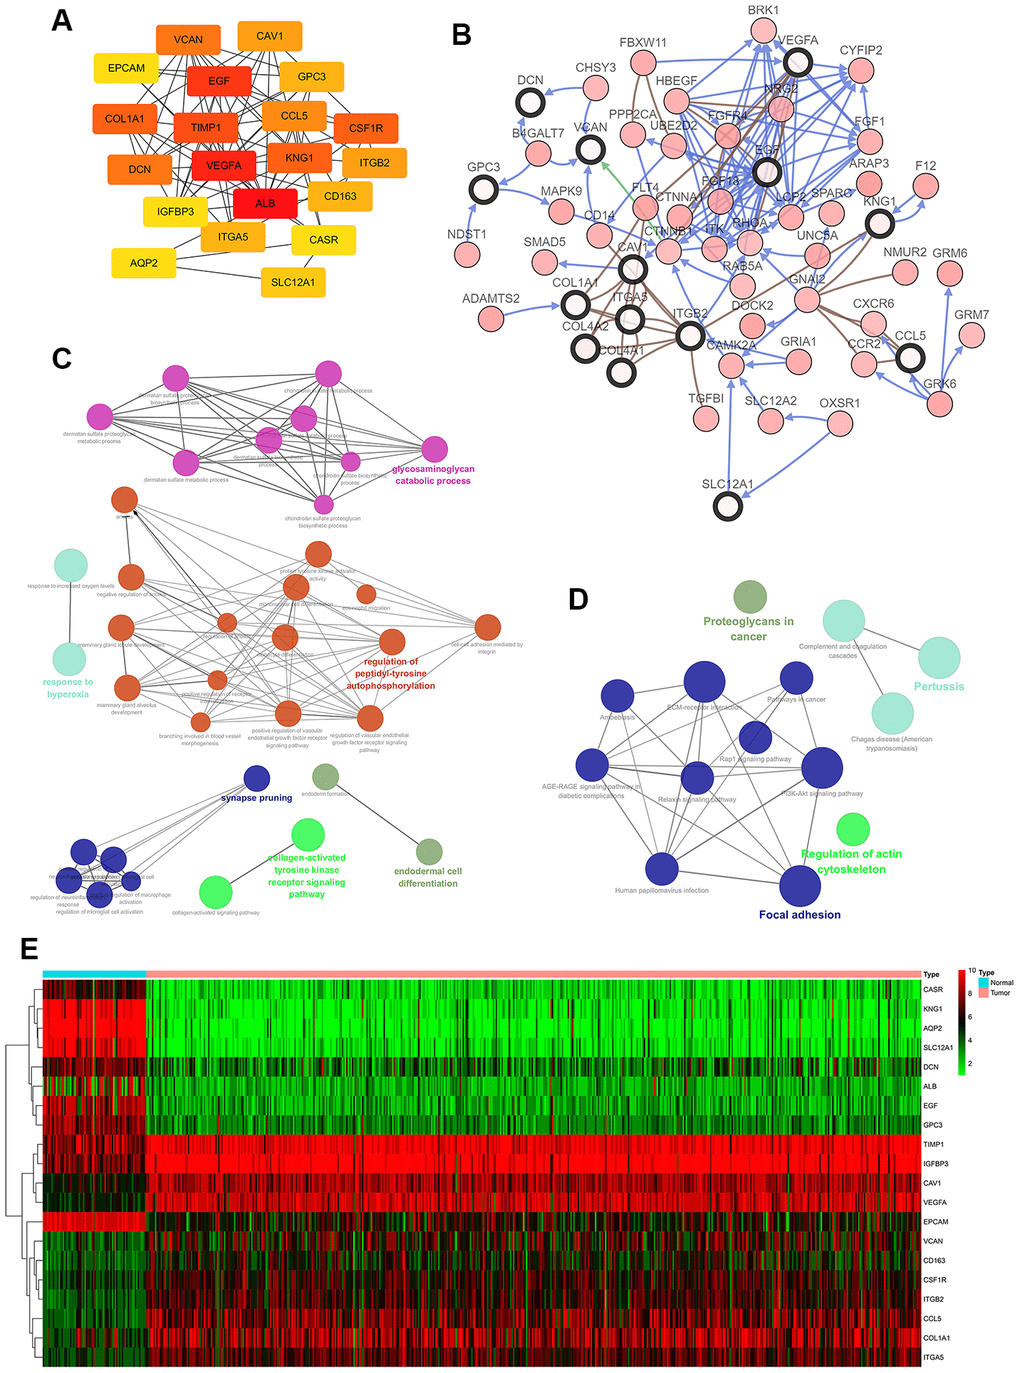
Figure 2.Interaction network and analysis of hub genes. (A) The 20 most important hub genes were screened using the Cytoscape software plugin cytoHubba. (B) Hub genes and their co-expressed genes were analyzed using the cBioPortal. Nodes with a bold black outline represent hub genes. Nodes with thin black outlines represent co-expressed genes. (C) Biological processes functional annotation analysis of hub genes was performed using ClueGO and CluePedia. Different colors of nodes refer to the functional annotation of ontologies. Corrected P value <0.01 was considered statistically significant. (D) KEGG functional annotation analysis of hub genes was performed by ClueGO and CluePedia. Different colors of nodes refer to the functional annotation of ontologies. Corrected P value <0.01 was considered statistically significant. (E) Hierarchical clustering heatmap of the 20 most important hub genes was constructed from a TCGA cohort. Red indicates that the relative expression of genes was upregulated, green indicates downregulation, and black indicates that no significant change in gene expression was observed; gray indicates that signal strength was not high enough to be detected. Abbreviation: TCGA: the cancer genome atlas program; KEGG: Kyoto Encyclopedia of Genes and Genomes.