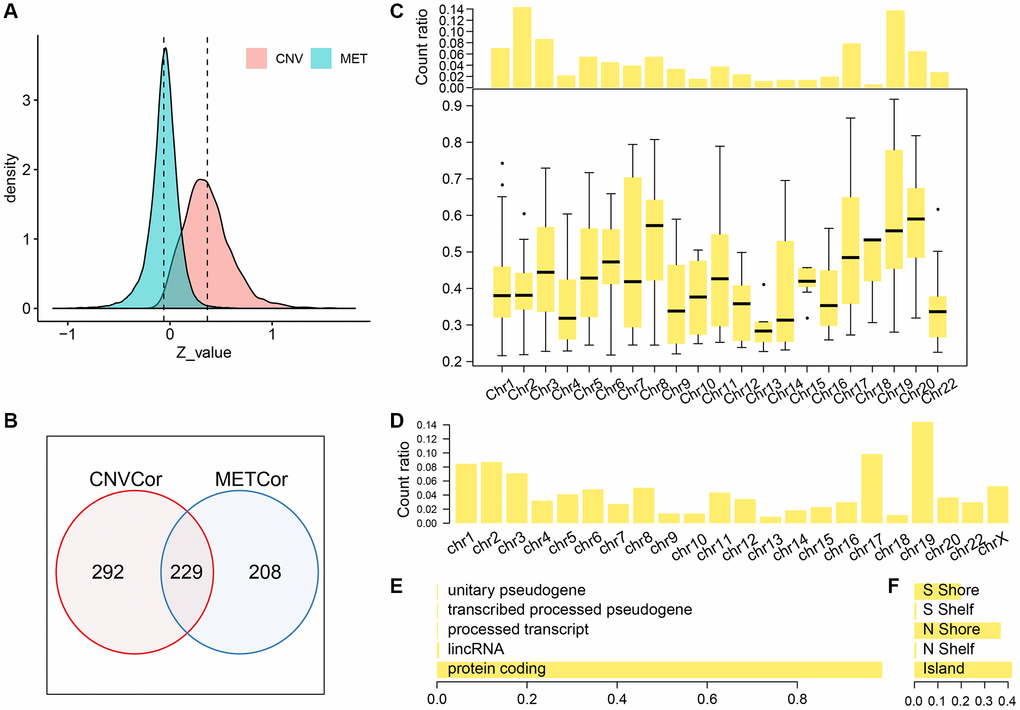
Figure 1.Profiles of CNV-G and MET-G features. (A) z-value distribution of CNV-G and MET-G. (B) The overlap between CNV-G and MET-G. (C) Chromosome distribution (top panel) and correlation (bottom panel) of CNV-G. (D) Chromosome distribution of MET-G. (E) MET-G gene type. (F) The proportion of MET sites.