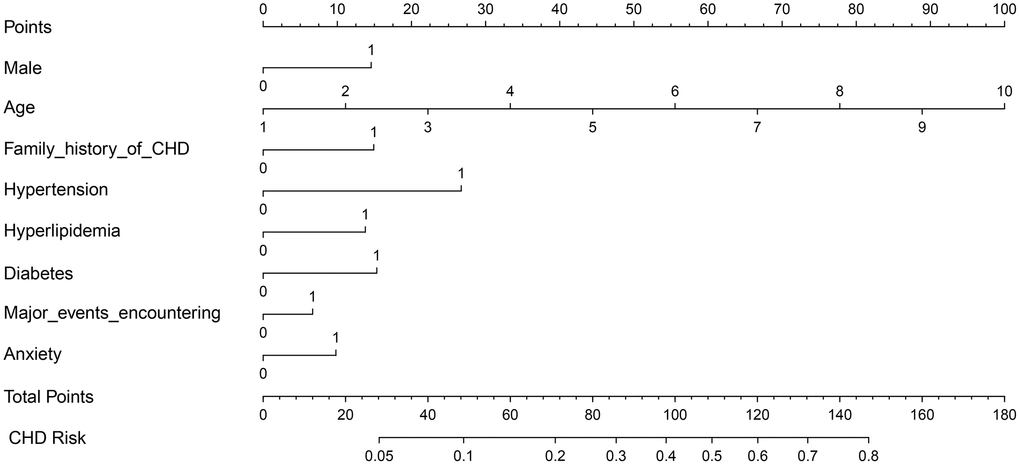
Figure 2.Nomogram for predicting CHD risk. The value of each variable was scored on a point scale from 0 to 100, after which the scores for each variable were added together. That sum is located on the total points axis, which enables us to predict the probability of CHD risk. For age categories, 1= 10 to 20, 2 = 21 to 30, 3 = 31 to 40, 4 = 41 to 50, 5 = 51 to 60, 6 = 61 to 70, 7 = 71 to 80, 8 = 81 to 90, 9 = 91 to 100, 10 = 101 to 110 year. For other variables, 0 = no and 1 = yes.