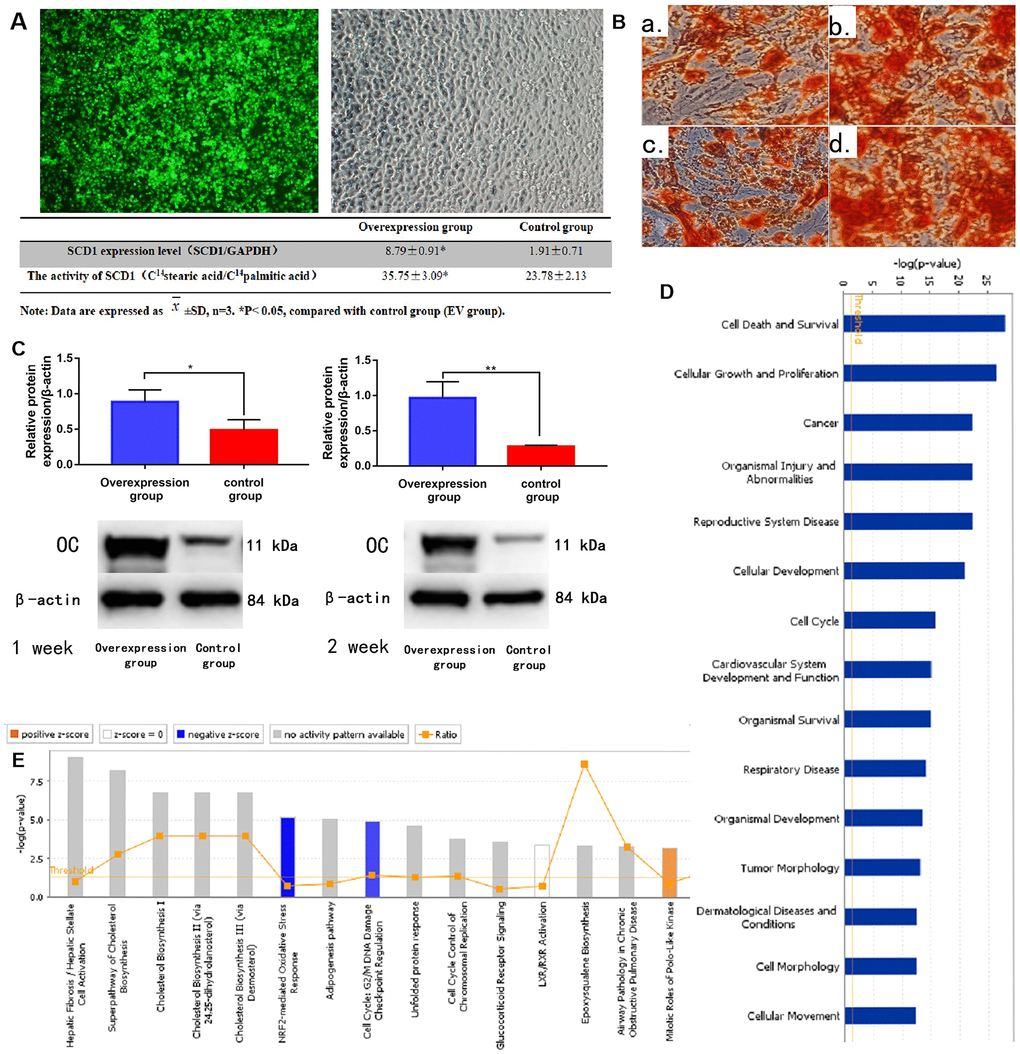
Figure 2.SCD1 overexpression promotes osteogenic differentiation and induces expression changes in BM-MSCs. (A) Fluorescence staining showed the transfection of BM-MSCs with SCD1 lentivirus. Comparison results of SCD1 expression and activity between the SCD1 overexpression and control groups were showed in the table beneath. Data are expressed as means ± standard deviations (n = 6). *P< 0.05 vs. control (EV) group. (B) Cetyl staining (a, b: 1-week SCD1 post-transfection; c, d: 2-weeks SCD1 post-transfection; a, c: control; b, d: overexpression). (C) Western blot results. (D) Signal pathway histogram showing the enrichment of differentially expressed genes in the classical signaling pathway. All signal paths were sorted using –log(P); orange, Z score>0; blue, Z score < 0. Z scores > 2 indicate significant pathway activation and Z scores < –2 indicate significant pathway inhibition. The ratio of the number of differentially expressed genes to the number of all genes in the signaling pathway is given. The NRF2-mediated oxidative stress response was significantly inhibited, (Z score = –21.121). (E) Disease and function histograms showing the enrichment of differentially expressed genes. All diseases and functions were sorted using –log(P).