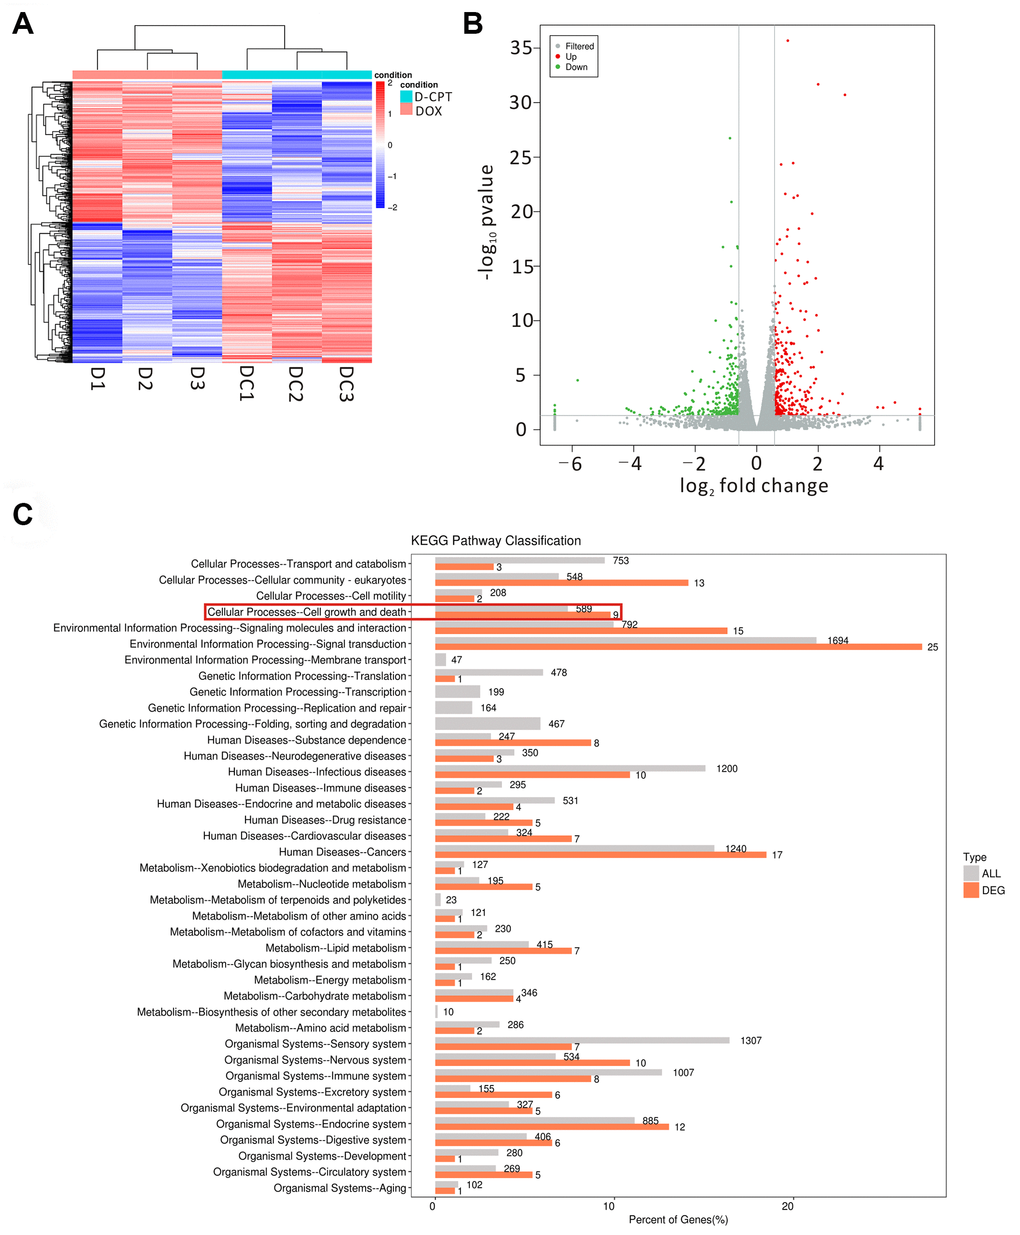
Figure 5.Effects of the different regulated genes and pathways of cryptotanshinone (CPT) on the heart tissues of the DOX-treated rats using transcriptomic profiling. Changed genes in the heart tissues of the two groups displayed by a heat map (D1-3 = DOX group, DC1-3 = DOX + CPT group) (A). The volcano map exhibits the differentially regulated genes by comparison of the two groups (DOX and DOX + CPT groups); the gray scatter denotes the non-significantly differentially expressed genes; both red and green scatters denote the significantly differentially expressed genes; the x-axis represents log2 fold change, and the y-axis represents the –log10P value (B). KEGG pathway classification; the horizontal axis represents the ratio (%) of the total number of genes (differentially expressed genes) annotated with each level 2 metabolic pathway and the genes (differentiated genes) annotated to the KEGG pathway, and the vertical axis represents the level 2 pathway term; the number on the right side of the column represents the annotation of the number of differentially expressed genes in the level 2 pathway term (C).