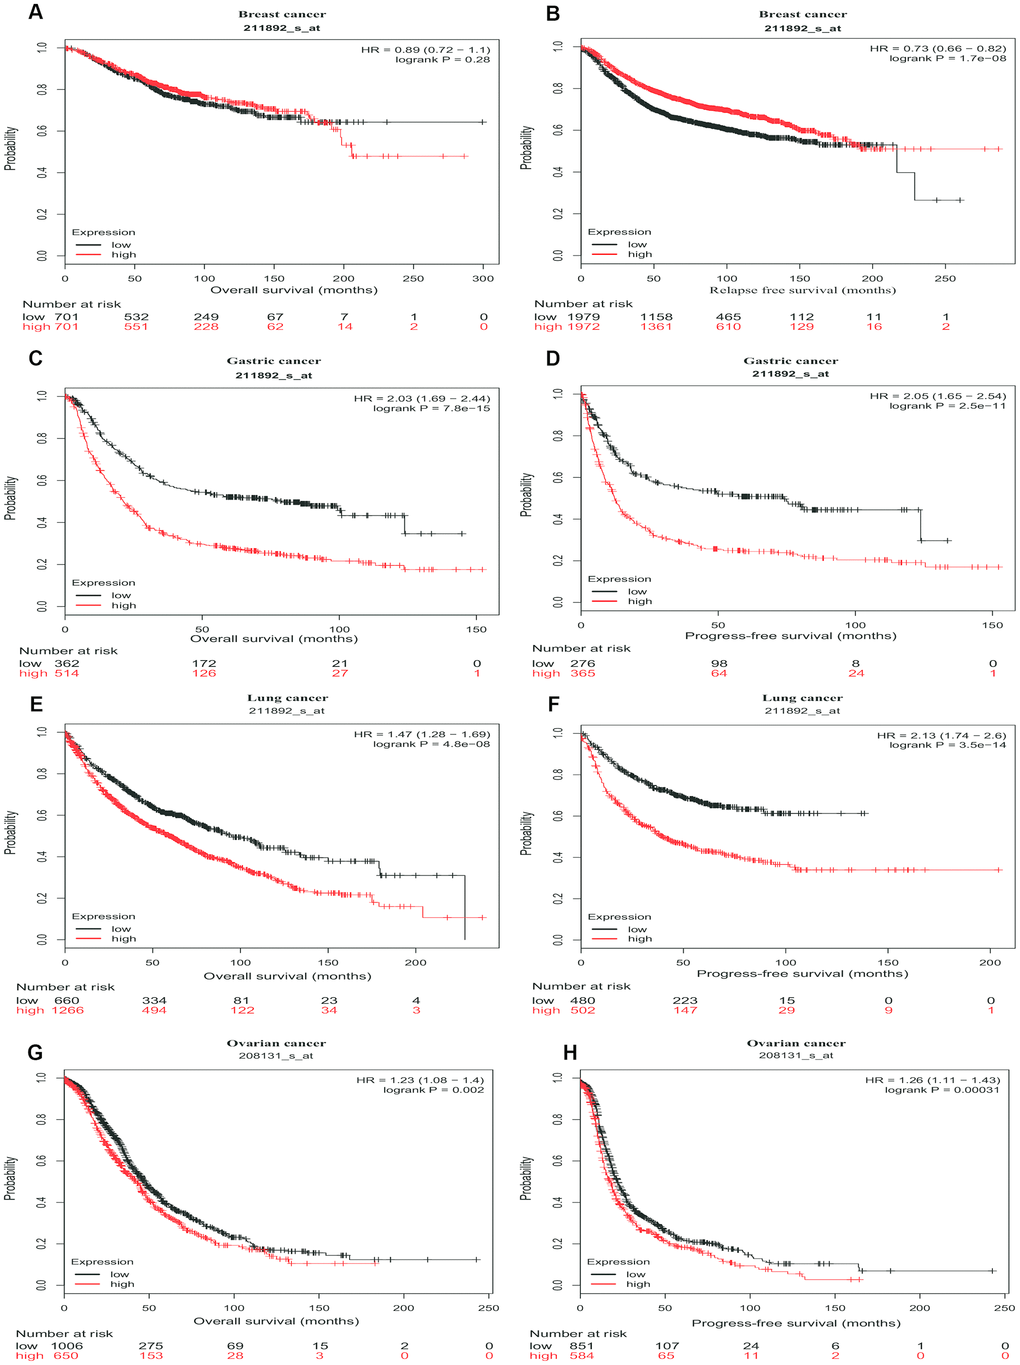
Figure 3.Survival curves of high or low expression of PTGIS in different tumors from Kaplan-Meier plotter. (A, B) OS and DFS survival curves of breast cancer (n = 1,402 and n = 3,951, respectively). (C, D) OS and PFS survival curves of gastric cancer (n = 876 and n = 641, respectively). (E, F) OS and PFS survival curves of lung cancer (n = 1,926 and n = 982, respectively). (G, H) OS and PFS survival curves of ovarian cancer (n = 1,656 and n = 1,435, respectively). OS, overall survival; PFS, progression-free survival; DFS, disease-free survival.