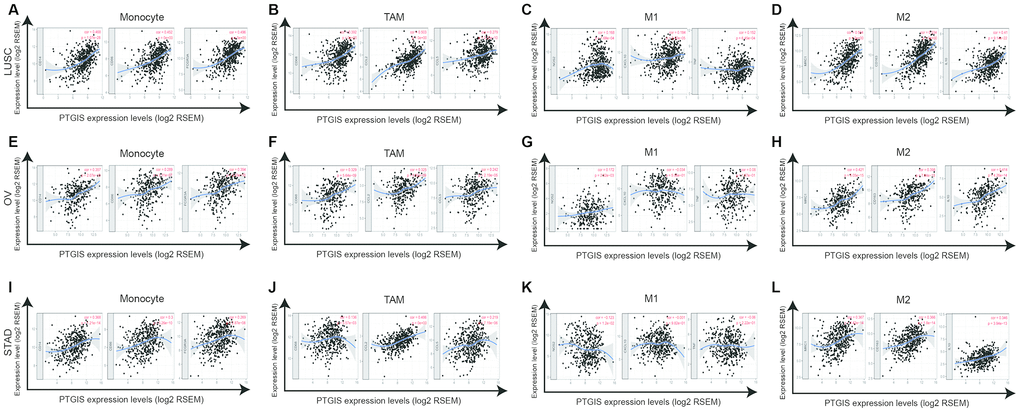
Figure 5.PTGIS expression correlated with macrophage polarization in LUSC (lung squamous cell carcinoma), OV (ovarian serous cystadenocarcinoma) and STAD (stomach adenocarcinoma). Markers included CD14, CD86 and FCGR3A for monocytes; CD68, CCL2 and CCL5 for TAMs (tumor-associated macrophages); NOS2, CXCL10, and TNF for M1 macrophages; and MRC1, CD163, and IL10 for M2 macrophages. (A–D) Scatterplots of correlation between PTGIS expression and the expression of gene markers of monocytes (A), TAMs (B), and M1 (C) and M2 macrophages (D) in LUSC (n = 496). (E–H) Scatterplots of correlation between PTGIS expression and the expression of gene markers of monocytes (E), TAMs (F), and M1 (G) and M2 macrophages (H) in OV (n = 537). (I–L) Scatterplots of correlation between PTGIS expression and the expression of gene markers of monocytes (A), TAMs (B), and M1 (C) and M2 macrophages (D) in STAD (n= 407).