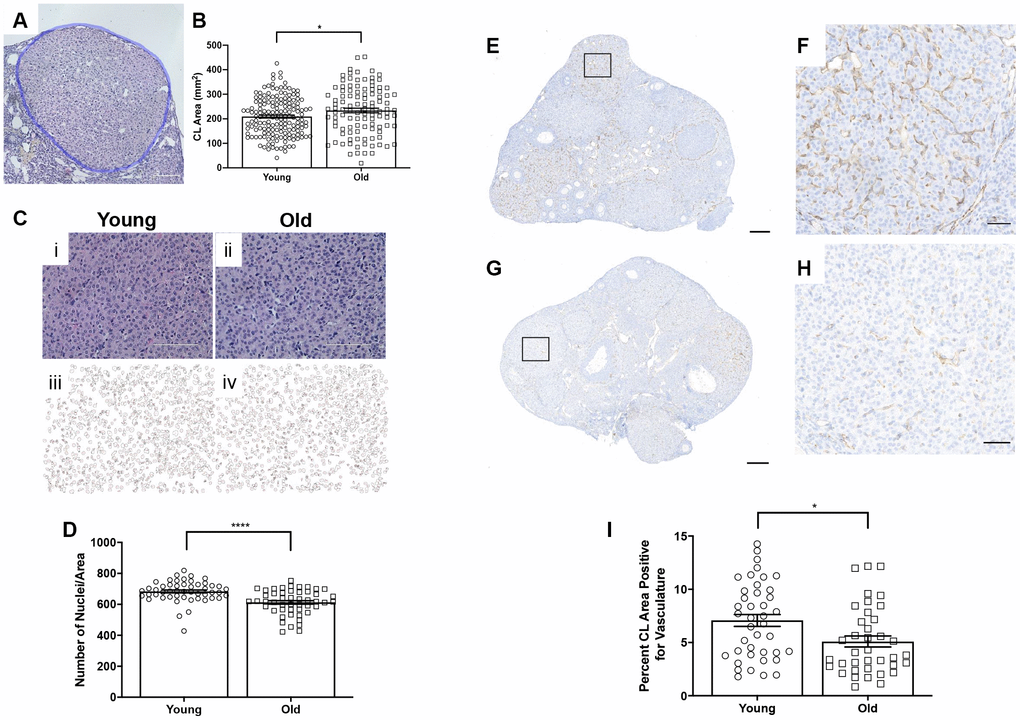
Figure 6.CLs exhibit age-associated structural differences. (A) Representative H&E-stained CL. The perimeter of the CL is outlined in blue. The scale bar is 50 μm. (B) Graph showing the area of each CL. Each data point corresponds to one CL. A t-test was performed; asterisk indicates significance (P = 0.022). (C) Images showing how luteinized area was determined at 40X magnification and the same images in ImageJ software. (D) Graph showing the average number of nuclei per defined CL area. Each data point corresponds to one CL. A t-test was performed; asterisks denote P < 0.0001. (E) Representative image of CD31 staining in reproductively young ovarian tissue with the boxed region in (F) and (G) representative image of CD31 staining in reproductively old ovarian tissue with the boxed region in (H). (I) Graph showing the percent of CL area positive for vasculature. A t-test was performed (P = 0.01). Scale bars are (E, G) 200 μm and (F, H) 50 μm. Data are represented as mean ± SEM.