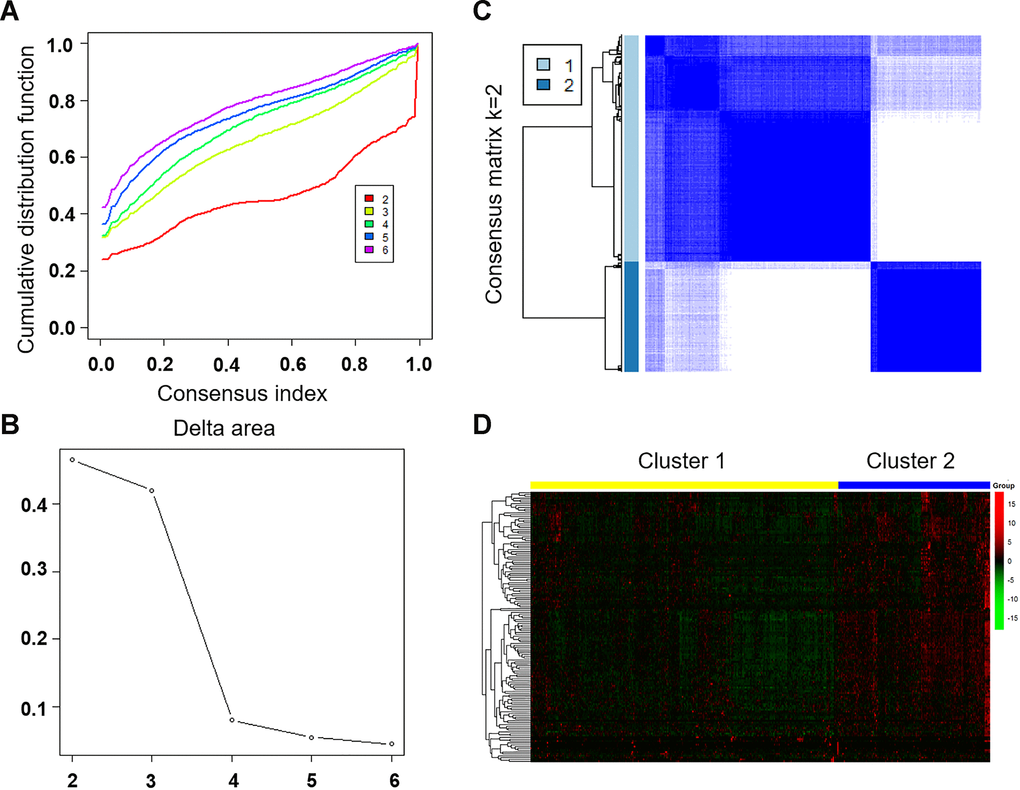
Figure 3.Unsupervised clustering of LUAD using immune-related lncRNA expression data. (A) Consensus CDF plot and consensus index for k =2 to 6 are represented. X axis represents consensus index, Y axis represents CDF. (B) Cumulative distribution function graph of the consistency matrix at K = 2. The blue and white heatmap displays sample consensus. (C) Delta area score map. X-axis represents the number of clusters and Y-axis represents the relative increase in cluster stability. (D) Heat map represents the expression of immune-related lncRNA in cluster 1 and cluster 2. Red represents high expression and green represents low expression. CDF: Cumulative Distribution Function.