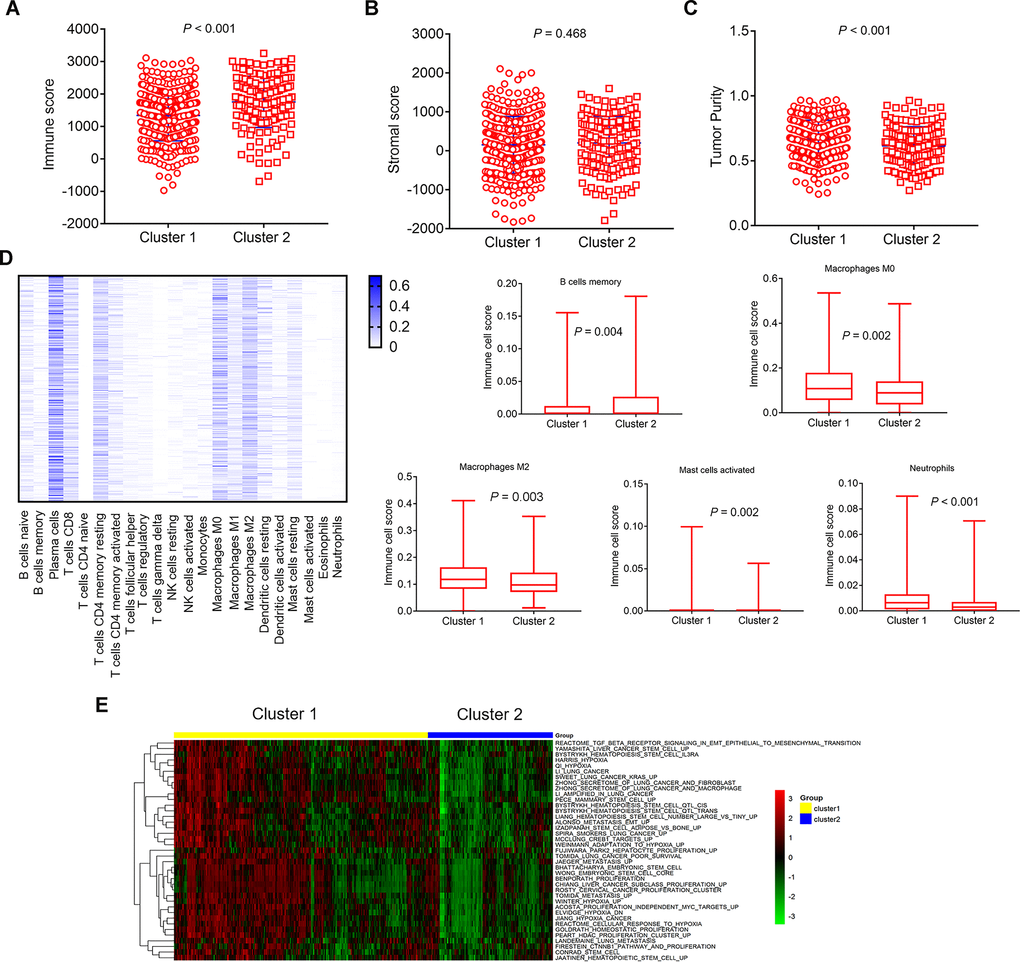
Figure 4.Comparison of composition and immune cells infiltration of the tumor immune microenvironment in LUAD samples and GSVA pathways analysis with differential enrichment. (A–C) Comparison of composition of TME (immune score, stromal score, and tumor purity) between cluster 1 and cluster 2. (D, left) Heat map represents the relative levels comparison of different immune cell types. The darker the blue, the higher the expression. (D, right) Comparison of immune cells infiltration (Macrophages M0, Macrophages M2, Mast cells activated, Neutrophils, B cells memory). (E) Heat map represents the the changes of related pathways in cluster 1 and cluster 2. The color changes from green to red, indicating an increase in the value of the enriched score. Yellow represents cluster 1 and blue represents cluster 2. TME: tumor microenvironment; GSVA: Gene Set Variation Analysis.