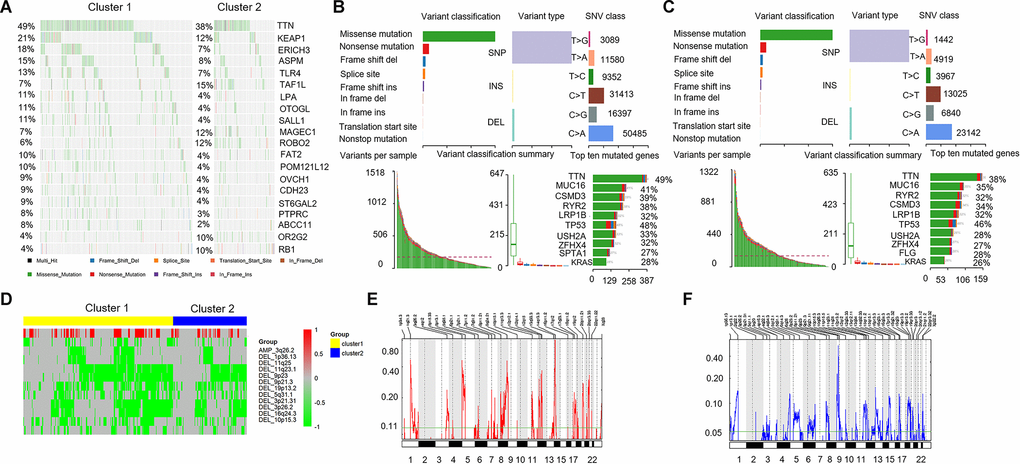
Figure 5.Comparison of mutant genes associated with immune activation and CNVs profile. (A) Mutation spectrum of the top 20 mutated genes with the highest number in cluster 1 and cluster 2. (B, C, above) The variant classification, variant type, and SNV class in cluster 1 and cluster 2. (B, C, below). Variants per sample, variant classification summary, and top ten mutated genes. (D) Comparison of CNVs profile (amplification and deletion) in cluster 1 and cluster 2. Yellow represents cluster 1 and blue represents cluster 2. Red represents the amplified portions and green represents deleted portions. (E, F) Areas with significant copy amplification and deletion of lncRNAs. G-scores (left) are normalized values of the amplification/ deletion signals and indicate the degree of gene amplification/ deletion. The larger the G-scores, the greater the degree of gene amplification/ deletion. The Q value (right) is the significance level of the amplification/ deletion, and the green line represents the threshold value of the significance level with Q value = 0.25. CNVs: copy number variations; SNV: single nucleotide variant.