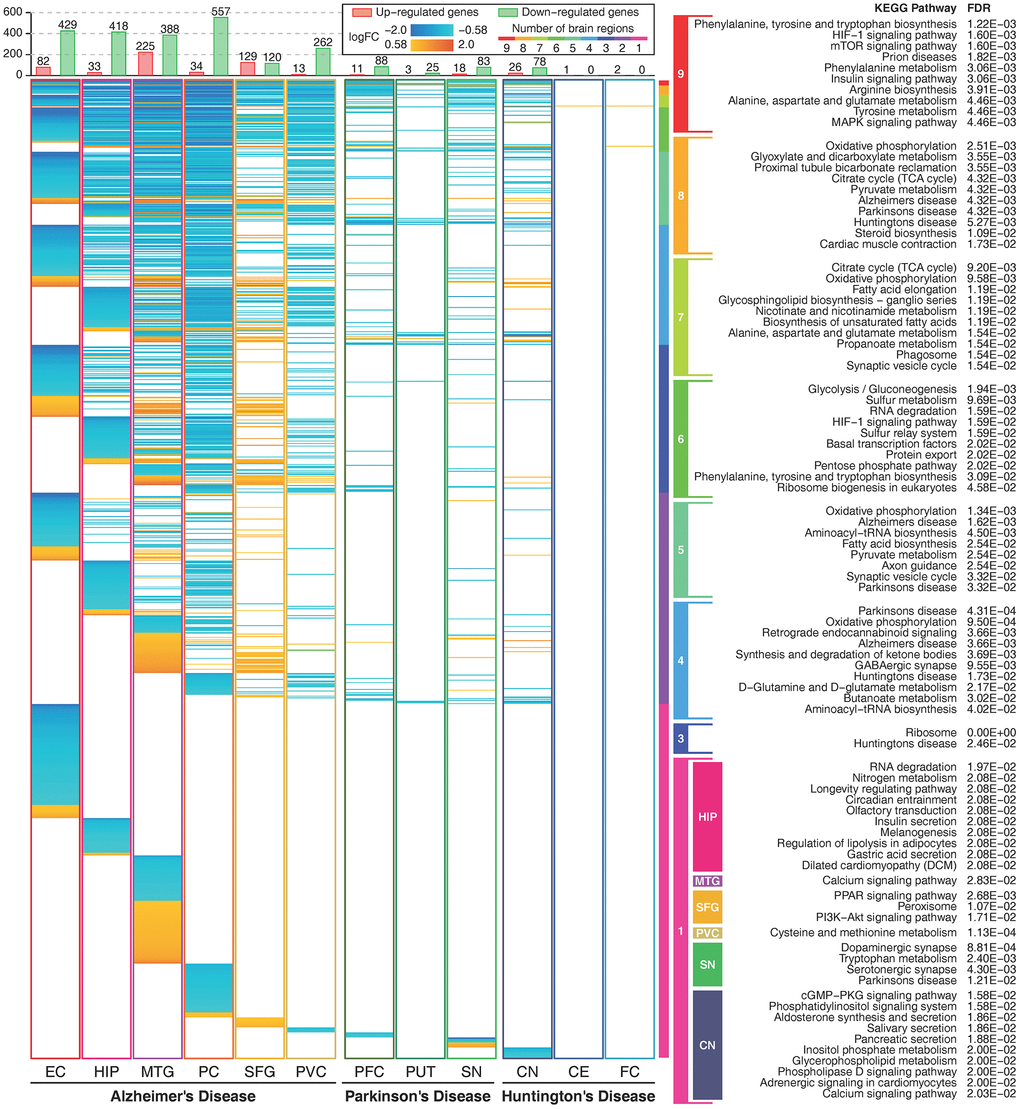
Figure 2.Expression profiles of metabolic genes and their functions. The figure shows metabolic genes with absolute logFC values higher than log2(1.5) in 12 brain regions. The figure shows 1164 unique metabolic genes. The orange color indicates that the gene is upregulated, and the cyan color indicates that the gene is downregulated. The rainbow color bar shows the commonly deregulated genes in multiple brain regions and their correlated metabolic pathways. Enriched metabolic pathways of brain region-specific deregulated genes are shown in colored boxes. Deregulated genes in two brain regions and deregulated genes only in the EC and the PC in AD, and the PFC in PD showed no significant enriched pathways.