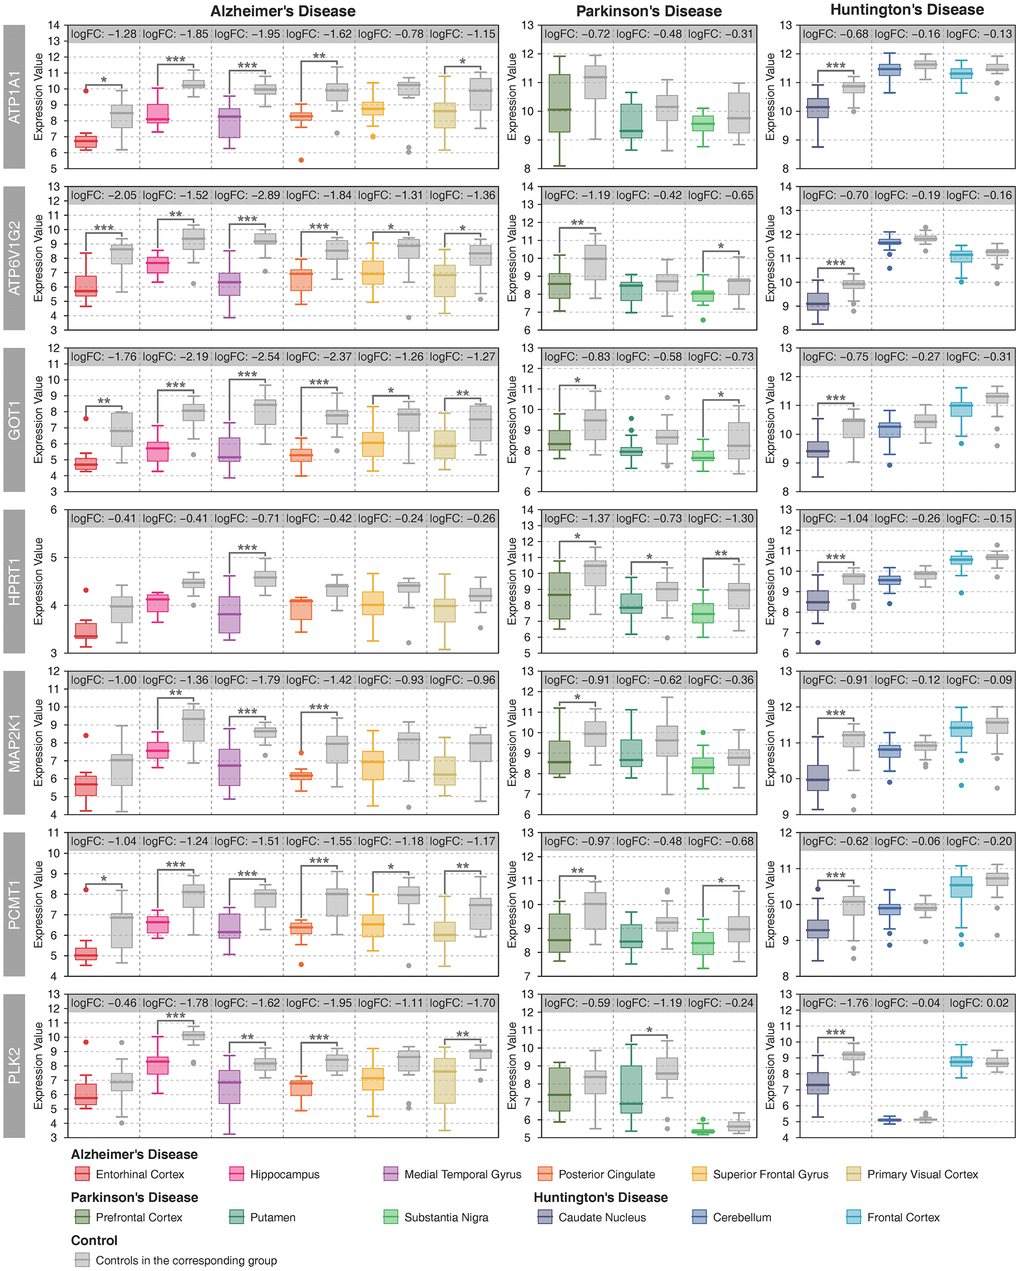
Figure 3.Expression patterns of key metabolic genes. Patient samples with different brain regions are represented by different colors, and the gray color represents the controls in the corresponding group. Student’s t-test was used to compare the expression differences between cases and controls. Statistical significance: * P < 0.05, ** P < 0.01, *** P < 0.001.