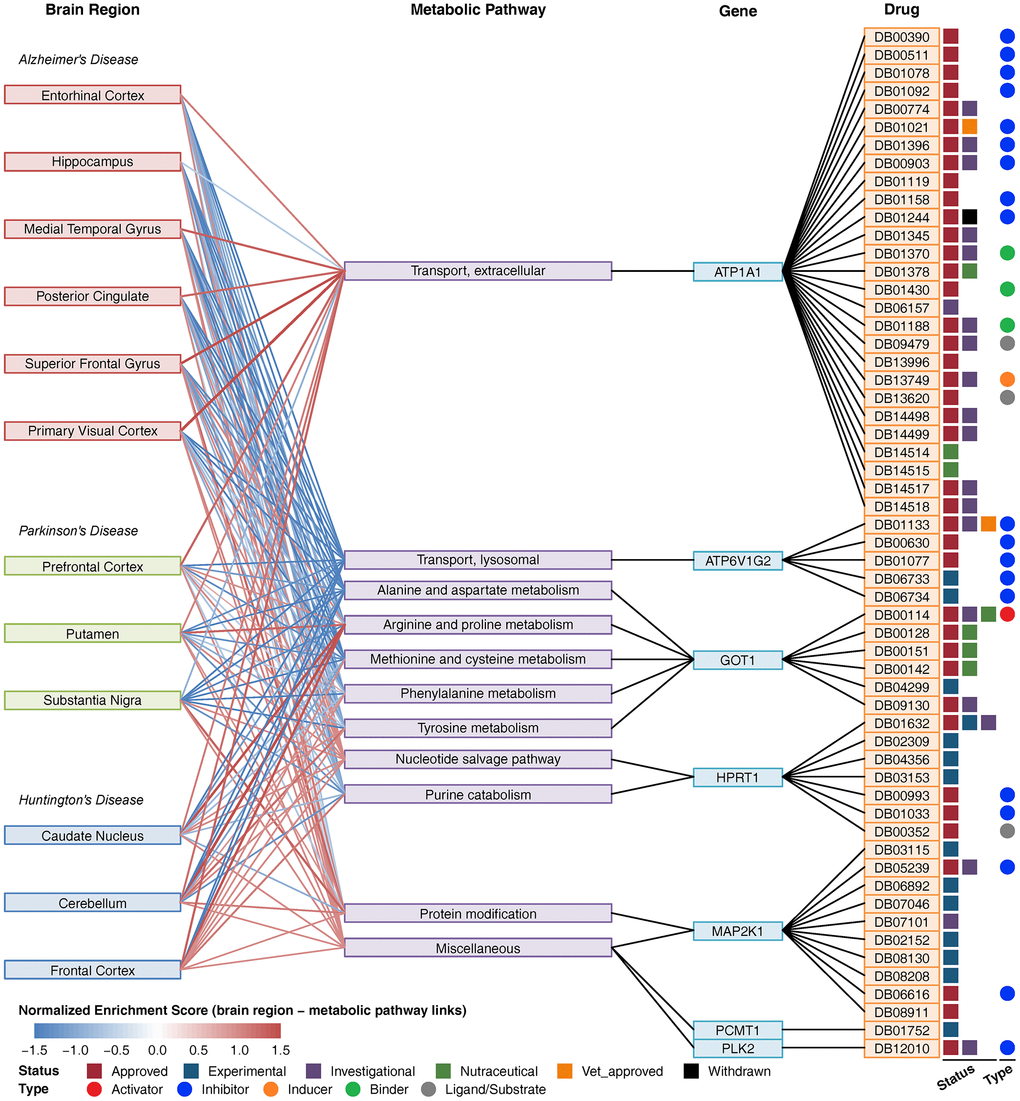
Figure 4.Composite network of brain regions, metabolic pathways, key metabolic genes and drugs. The link between brain region and metabolic pathway shows a normalized enrichment score of the pathway in the brain region. The red color indicates upregulation, and the blue color indicates downregulation. The link between metabolic pathways and genes indicates that the gene is involved in the pathway. The link between the gene and drug indicates that the drug can target the protein encoded by the gene. Drug status (approved, experimental, investigational nutraceutical, vet_approved, and withdrawn) is shown as colored squares. Drug type (activator, inhibitor, inducer, binder, ligand/substrate) is shown as colored circles.