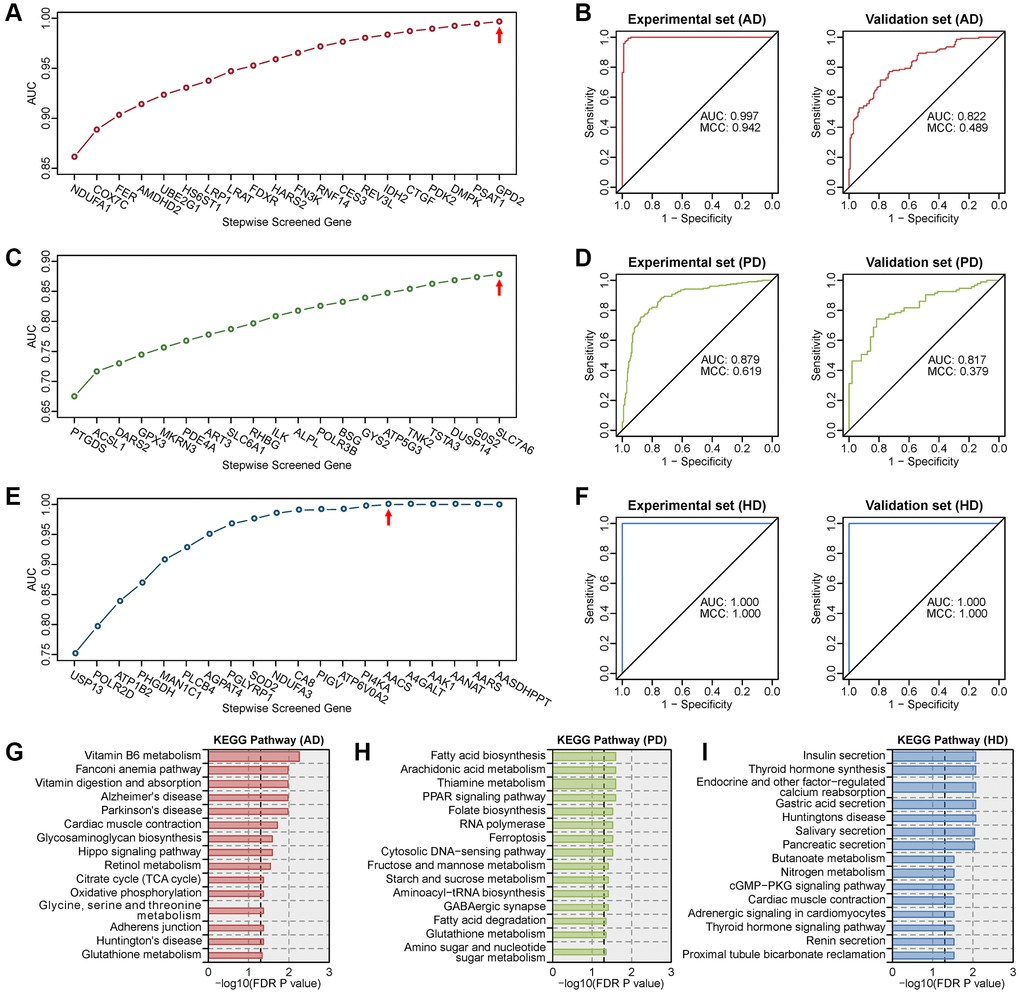
Figure 5.Screening of the optimal multigene diagnostic model for three diseases. (A) Stepwise screened multigene prediction models in AD. (B) Receiver operating characteristic (ROC) curves of the screened optimal diagnostic model in AD. (C) Stepwise screened multigene prediction models in PD. (D) ROC curves of the screened optimal diagnostic model in PD. (E) Stepwise screened multigene prediction models in HD. (F) ROC curves of the screened optimal diagnostic model in HD. For panels A, C and E, from left to right on the x-axis (stepwise screened genes), each additional gene corresponds to a model (for example, in panel A, NDUFA1 represents model 1, which contains one gene, NDUFA1; COX7C represents model 2, which contains two genes including NDUFA1 and COX7C). The red arrow shows the optimal model for each disease. Area under the curve (AUC) and Matthews correlation coefficient (MCC) were shown in the ROC curve. Details of the experimental set and validation set are provided in Supplementary Table 2. (G) Enriched KEGG pathway analysis of genes in the optimal diagnostic model for AD. (H) Enriched KEGG pathway analysis of genes in the optimal diagnostic model for PD. (I) Enriched KEGG pathway analysis of genes in the optimal diagnostic model for HD.