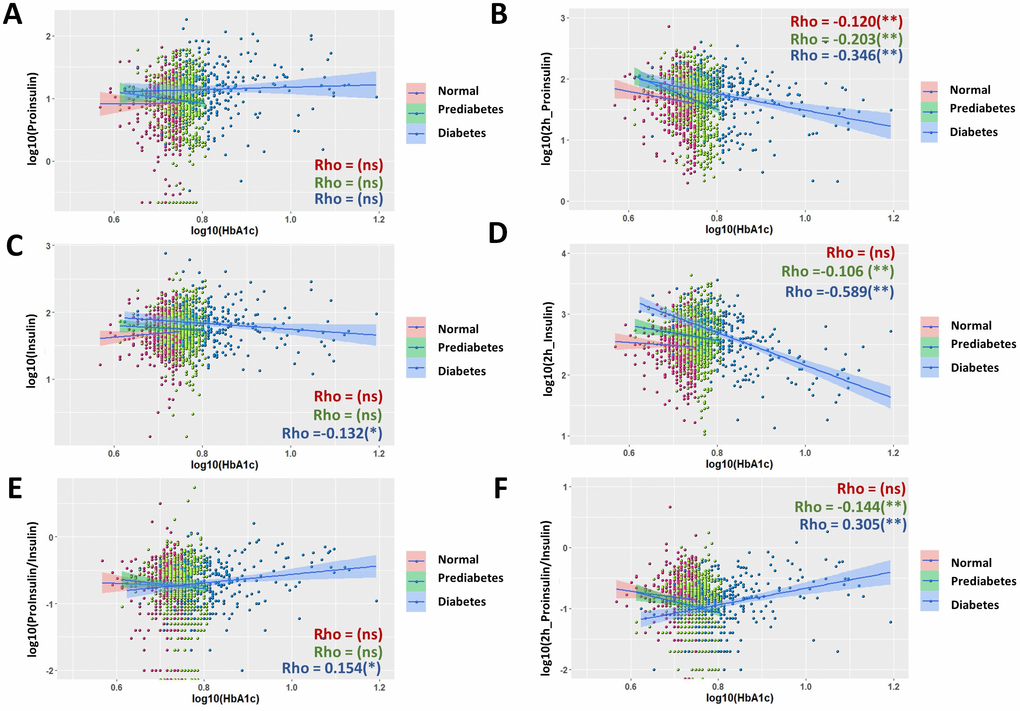
Figure 3.Nonuniform correlations of proinsulin, insulin and P/I ratio with fasting hemoglobin A1C (HbA1c) in normal, prediabetic and diabetic groups. (A) Fasting proinsulin levels were not significant associated HbA1c in all groups of normal, prediabetes and diabetes. Data from 1579 participants were log transformed, scatter plotted and linear modeled by using R language for each subgroup (normal in red, prediabetes in green and diabetes in blue). Association strength was evaluated by Spearman's association coefficient (Rho) using SPSS software: ns, not significant. Shaded line, linear regression with 95% of confidence interval (CI). (B) Negative association of proinsulin levels after 2 hours of glucose stimulation with fasting HbA1c. The association is stronger in diabetic group (Rho = 0.346) than in normal and prediabetic groups. (C) Fasting insulin levels had weak and negative association with fasting HbA1c in diabetic group but not normal and prediabetic groups. (D) Insulin levels after 2 hours of glucose stimulation had no correlation with fasting HbA1c in normal group, weak association in prediabetic group and close to strong association in diabetic group (Rho= -0.589). (E) Fasting P/I ratio and fasting HbA1c were weakly associated in diabetic group not but normal and prediabetic groups. (F) P/I ratio after 2 hours of glucose stimulation was moderately associated with fasting HbA1c in diabetic group, weakly in prediabetic group but not significant in normal group.