


Introduction
The most prominent characteristic of Type 2 Diabetes (T2D) is the abnormally high plasma glucose levels (hyperglycemia), which can lead to complications including cardiovascular morbidity, renal impairment, retinopathy [1, 2]. The incidence of T2D is highly correlated with age [3, 4]. Absorption of plasma glucose by peripheral tissues requires insulin, which is secreted by β-cells in the pancreas [5]. β-cell dysfunction is well recognized to directly cause diabetes; lack of β-cell due to autoimmune disease is the major cause of type 1 diabetes (T1D) [6]. In T2D however, hyperglycemia is generally resulted from more complex factors including compromised function of β-cells and impaired insulin response of peripheral tissues, all of which are attributes of aging [5, 7]. The human insulin is a peptide composed of 51 amino acids (AA) processed from a premature 86-AA peptide called proinsulin in β-cells [8, 9]. Proinsulin is synthesized in the endoplasmic reticulum (ER), then transported to Golgi apparatus where posttranslational modifications and maturation happen [10, 11]. The matured insulin is then secreted into the plasma via intracellular vesicles. A significant fraction of proinsulin in the plasma remain uncleared and their function remains currently unknown [12, 13]. Studies suggest that approximately 10–20% of the circulating IRI are proinsulin and proinsulin is cleared from the plasma slower than mature insulin [14, 15]. The proinsulin levels and the proinsulin to insulin ratio (P/I ratio) are increased during aging [16].
Hyperproinsulinemia, a term describing the abnormal elevation of plasma proinsulin levels, has been proposed to be a predictor of subsequent development of both type 1 and type 2 Diabetes [15, 17]. In type 2 diabetes, the proinsulin levels are shown to be as high as mature insulin levels, indicating a defect in insulin processing [15, 17]. Other studies also find that fasting proinsulin levels are associated with insulin resistance [18] and type 2 diabetes [19–21]. Furthermore, non-diabetic twins of patients with T1D also show elevated proinsulin concentrations, suggesting that proinsulin is an indication of early subclinical β-cell dysfunction [17]. The P/I ratio has also been proposed as a predictor of hyperglycemia development. The P/I ratio at the fasting condition is highly responsive to acute insulin stimulation [22]. Similarly, Haffner et al. show that the P/I ratio is increased in individuals having insulin resistance syndrome [23]. In a most recent survey of 9396 Finnish men, both fasting and glucose-stimulated proinsulin levels are significantly associated with plasma glucose levels and insulin sensitivity [24].
However, other studies find that the elevation of proinsulin levels is a late event after manifestation of hyperglycemia [25]. Supporting this, glucose can stimulate proinsulin production in a dose-dependent manner [26], arguing against the idea that defect in proinsulin processing is causal to hyperglycemia and T2D. Another possible cause of elevated proinlusin levels is that, in response to high glucose, insulin secreting cells may try to speed insulin production, causing proinsulin to be incompletely processed and secreted to the plasma [27]. In addition, there are many inconsistent results regarding the relationship between P/I ratio and glucose tolerance. In insulin resistant, nondiabetic subjects, the fasting P/I ratio had no correlation with the degree of insulin resistance, despite the both are increased in these subjects [28].
In this study, we obtained multiple health parameters from 1579 individuals in Hainan Province, China from 2018-2019. FPG, HbA1C levels and plasma glucose levels after 2-hour oral glucose tolerance test (OGTT2hPG) were used to group them into normal, prediabetic and diabetic populations. We measured the proinsulin, insulin levels at both fasting and glucose-stimulated conditions and examined their correlations to diabetic indicators including FPG, HbAc1 and OGTT2hPG, and the insulin sensitivity index Matsuda index. We find that none of proinsulin, insulin or P/I ratio has strong correlation to these diabetic indicators in the whole population. By subgrouping analysis, we find that the correlations are distinct and sometimes opposite in normal, prediabetic and diabetic populations. Our results provide new perspectives regarding the functions of proinsulin, insulin and P/I ratio in predicting hyperglycemia development.
Results
In a study surveying the health information in provincial area of Hainan, China, we aimed to recruit over one thousand adults with diverse backgrounds and measure their physiological and metabolic parameters. We also conducted the 2-hour glucose tolerance test (OGTT) and measured the postprandial proinsulin, insulin and glucose levels in the plasma. The data collected from 1579 individuals were complete and valid, which were summarized in Supplemental Information, Supplementary Table 1. The original data can be found in Supplementary Data (Supplementary evidence of original data). The processed data can be found in Supplementary Table 2.
We divided the whole population into 3 groups: normal, diabetes and prediabetes according to the standard set by American Diabetes Association [31, 32]: diabetes, fasting plasma glucose (FPG) ≥7.0 mmol/L or oral glucose tolerance test (OGTT) with 2-hour plasma glucose (2hPG) ≥11.1 mmol/L or HbA1c ≥6.5%; prediabetes, 5.6mmol/L ≤ FPG<7.0 mmol/L or 7.8mmol/L ≤ 2hPG<11.1mmol/L or 5.7% ≤ HbA1C<6.4%; otherwise normal. Among the participants, 639 (40.5%) were normal, 705 (44.6%) were prediabetic and 235 (14.9%) were diabetic. The average age was 41.69 years for the normal group, 50.91 for prediabetic group and 56.75 for diabetic group, confirming the age-dependence of T2D (Supplementary Table 1). Other physiological and metabolic parameters including weight, height, body mass index (BMI), waist circumference, systolic and diastolic pressure, heartbeat, FPG, postprandial glucose (OGTT2hPG), triglyceride, total cholesterol, LDL, HDL, blood urine acid, HbA1c, Vitamin D3, fasting proinsulin levels, postprandial proinsulin levels (2h proinsulin), fasting insulin levels and postprandial proinsulin levels (2h insulin) were all averaged and compared among the normal, prediabetic and diabetic groups (Supplementary Table 1). The subgroups were further divided to male and female groups and physiological and metabolic parameters were compared in the subgroups.
Proinsulin, insulin and proinsulin to insulin (P/I) ratio in normal, prediabetic and diabetic population
The fasting proinsulin levels and fasting insulin levels were all gradually increased from normal to diabetic group (Figure 1A, 1B). Fasting proinsulin increased from 11.56±8.14 to 13.47±10.63 pmol/L in prediabetes and 21.91±23.82 pmol/L in diabetes. Similarly, fasting insulin levels also increased from 57.53±34.03 to 67.62±44.18 pmol/L in prediabetes and 86.69±84. 84 pmol/L in diabetes (Supplementary Table 1). However, the fasting P/I ratio was not significantly increased from normal to prediabetic group and only marginally from prediabetic to diabetic group (Figure 1C). After 2 hours of glucose stimulation in the OGTT, proinsulin levels were not significantly different between normal (57.80±50.26 pmol/L) and prediabetic group (62.99±51.66 pmol/L), but slightly increased in diabetic group (74.52±63.44 pmol/L) (Figure 1D and Supplementary Table 1). Postprandial insulin levels were significantly increased from normal (379.99±295.46 pmol/L) to prediabetic group (572.72±491.65 pmol/L) but were not further increased in diabetic group (600.48±570.17 pmol/L). The changes in the proinsulin and insulin levels after 2-hour OGTT resulted in a decrease in P/I ratio from normal to prediabetic group but increase from prediabetic to diabetic group (Figure 1F). The lack of pronounced increase in P/I ratio suggests that the proinsulin processing has no significant defect in prediabetic and diabetic population.
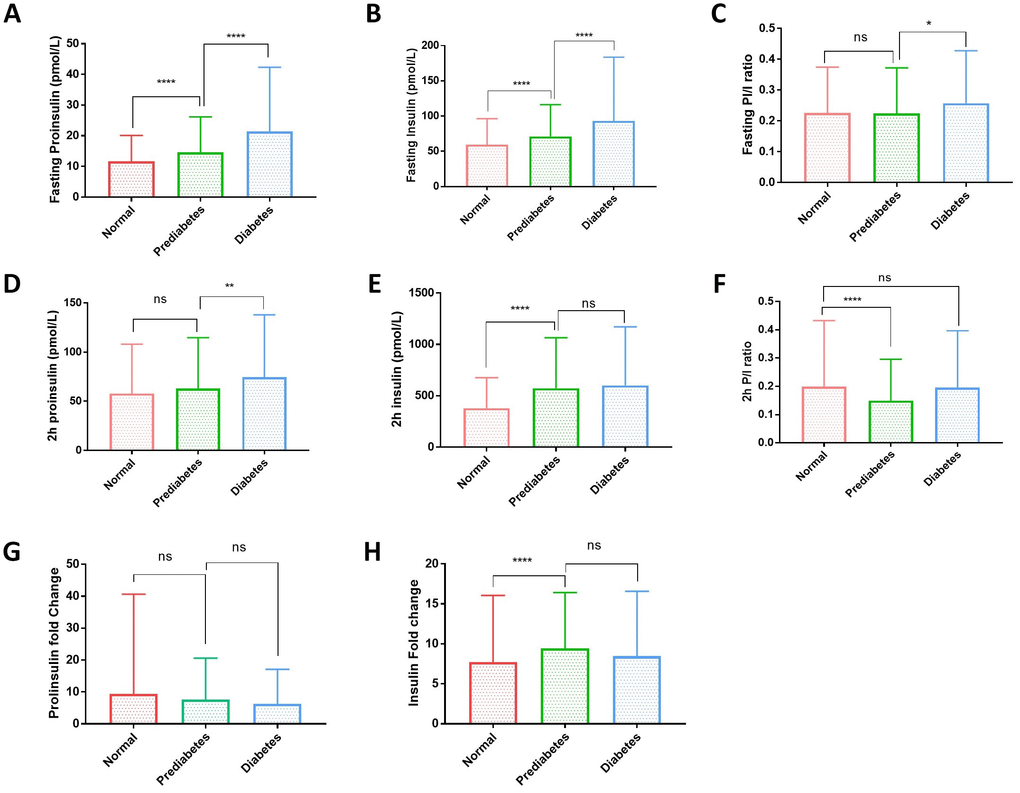
Figure 1. Plasma proinsulin, insulin levels and proinsulin to insulin (P/I) ratio in normal, prediabetic and diabetic groups. (A) Fasting proinsulin levels graduately increased from normal to prediabetic and diabetes population. A cohort of 1579 participants were grouped to normal, prediabetes and diabetes according to the standard set by American Diabetes Association: diabetes, fasting plasma glucose (FPG) ≥7.0 mmol/L or oral glucose tolerance test (OGTT) with 2-hour plasma glucose (2hPG) ≥11.1 mmol/L or HbA1c ≥6.5%; prediabetes, 5.6mmol/L≤FPG<7.0 mmol/L or 7.8mmol/L≤2hPG<11.1mmol/L or 5.7%≤HbA1C<6.4%; otherwise normal. Error bars: standard deviation. Student’s t-test: ****, P<0.0001. (B) Fasting insulin levels graduately increased from normal to prediabetic and diabetes population. Participants were grouped and data were analyzed as in (A). Student’s t-test: ****, P<0.0001. (C) Fasting proinsulin to insulin ratio (P/I ratio) had no difference between normal andes groups and only slight increase in diabetic group. Participants were grouped and data analyzed as in (A). Student’s t-test: *, P<0.05; ns, not significant. (D) Proinsulin levels after 2-hour glucose stimulation in an oral glucose tolerance test (2hOGTT) were significantly elevated in diabetes but not prediabetic groups. Student’s t-test: **, P<0.01; ns, not significant. (E) Insulin levels after 2-hour glucose stimulation in an OGTT were significantly elevated in prediabetic group but did not further increase in diabetic group. Student’s t-test: **, P<0.01; ns, not significant. (F) After 2hOGTT, proinsulin to insulin ratio (P/I ratio) had no difference between normal and diabetic groups but was significantly lower in prediabetic group. Student’s t-test: ****, P<0.0001; ns, not significant. (G) 2-hour glucose stimulation did not increase proinsulin levels in prediabetic and diabetic groups. Student’s t-test: ns, not significant. (H) 2-hour glucose stimulation increased Insulin levels in prediabetic group but did not further increase in diabetic group. Student’s t-test: ****, P<0.0001; ns, not significant.
2-hour glucose stimulation increased the proinsulin levels to around 5~10 folds in all subgroups (Figure 1G). However, 2-hour glucose stimulation increased the insulin levels significantly higher in prediabetic and diabetic group (Figure 1H), suggesting that insulin production remains sensitive to glucose stimulation and is not the major reason for hyperglycemia in type 2 diabetes in this cohort.
The correlation of proinsulin and insulin with FPG were different and sometimes opposite in normal, prediabetic and diabetic groups
Several previous studies have shown the association of proinsulin, insulin and the P/I ratio with FPG and suggest their applications in predicting T2D development [18, 24, 33]. We found that in the whole population examined here, all associations were generally weak (Supplementary Figure 1). By using spearman ranking, the association coefficient Rho is 0.266 between fasting proinsulin and FPG, 0.159 between glucose-stimulated proinsulin and FPG, 0.232 between fasting insulin and FPG, no significant association between glucose-stimulated insulin and FPG, 0.068 between fasting P/I ratio and FPG, no significant association between glucose-stimulated P/I ratio and FPG. By comparing normal, prediabetic and diabetic groups on the same scatter plot (red, green and blue, respectively), we noticed that the three groups have very different distribution. In diabetic group, glucose-stimulated proinsulin and insulin levels were not trending in the same way as those in normal and prediabetic group (Supplementary Figure 1B, 1D).
We then studied the association in each subgroup. Indeed, many associations were quite different among normal, prediabetic and diabetic groups (Figure 2). Although the associations with FPG had different strength (Rho) in different subgroups, they were mostly trending the same for fasting proinsulin (Figure 2A), fasting insulin (Figure 2C), fasting P/I ratio (Figure 2E) and glucose-stimulated P/I ratio (Figure 2F). However, for glucose-stimulated proinsulin and insulin levels, the associations to FPG were opposite, with positive association in normal and prediabetic group but negative association in diabetic group (Figure 2B, 2D). The strength of associations with FPG was also very different. Despite mostly weak associations in normal and prediabetic group, in diabetic group, FPG had moderate association with glucose-stimulated insulin levels (Figure 2D, Rho = -0.446) and glucose-stimulated P/I ratio (Figure 2F, Rho = 0.401), with the regression coefficient of β = -0.350 and 0.448, respectively (Table 1). The association remained significant after adjusting for sex, age and body mass index (BMI) (Table 1).
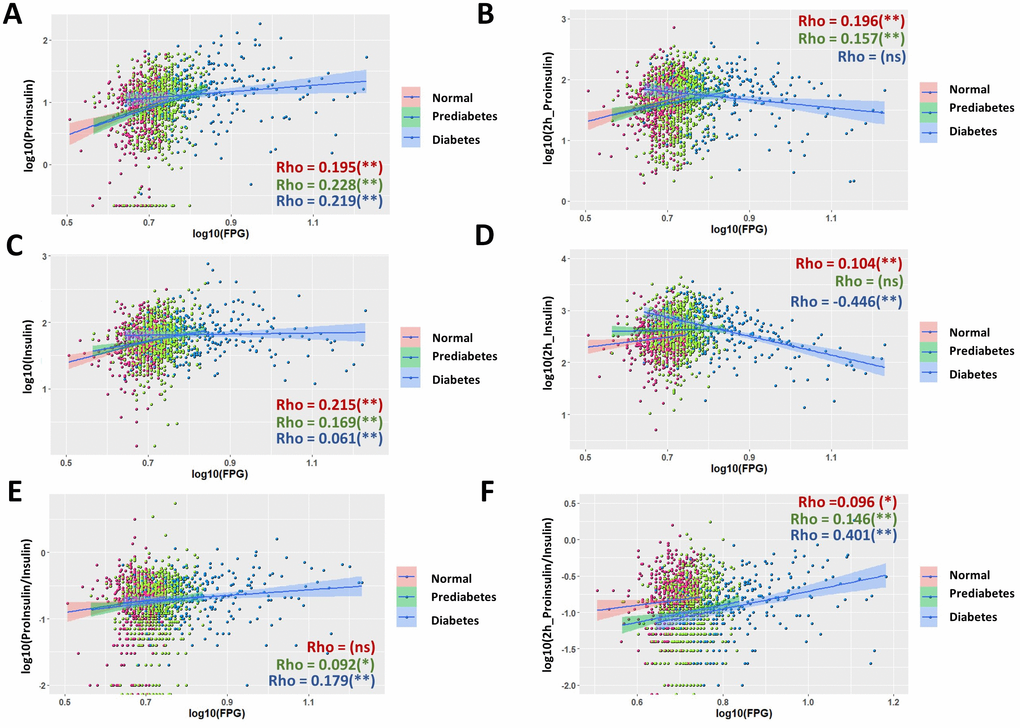
Figure 2. Nonuniform correlations of proinsulin, insulin and P/I ratio with fasting plasma glucose (FPG) in normal, prediabetic and diabetes population. (A) Correlation of fasting proinsulin levels with FPG in normal, prediabetic and diabetes populations. Data from 1579 participants were log transformed, scatter plotted and linear modeled by using R language for each subgroup (normal in red, prediabetes in green and diabetes in blue). Association strength was evaluated by Spearman's association coefficient (Rho) using SPSS software, with absolute Rho < 0.3 considered weak, 0.3≤Rho<0.6 moderate and Rho≥0.6 strong association; ns, not significant. Shaded line, linear regression with 95% of confidence interval (CI). (B) Distinct correlation of proinsulin levels after 2hOGTT to FPG levels in normal, prediabetic and diabetic groups. (C) Correlation of fasting insulin levels with fasting plasma glucose (FPG) in normal, prediabetic and diabetes populations. (D) Opposite correlation of 2h OGTT insulin levels to FPG levels in normal and diabetes subgroups. In diabetes, 2h OGTT insulin levels has negative correlation to FPG with moderate association strength (Rho = -0.446). (E, F) The strength of association (Rho) of P/I ratio were different among normal, prediabetic and diabetic groups. In diabetes, 2h OGTT P/I ratio has positive correlation to FPG with moderate association strength (Rho = 0.401).
Table 1. Regression study of the moderate and strong associations for proinsulin and insulin at fasting and glucose-stimulating conditions.
| Variable | Associated variable | Subgroup | Association coefficient (Rho) | Regression coefficient (β) | P | P1 | P2 | ||||||||||||||||||||||||||||||||||||||||||||||||||||||||||||||||||||||||||||||||||||||||||||
| Fasting proinsulin | Matsuda ISI | All | -0.463 | -0.191 | < 0.001 | < 0.001 | < 0.001 | ||||||||||||||||||||||||||||||||||||||||||||||||||||||||||||||||||||||||||||||||||||||||||||
| Matsuda ISI | Normal | -0.384 | -0.177 | < 0.001 | < 0.001 | < 0.001 | |||||||||||||||||||||||||||||||||||||||||||||||||||||||||||||||||||||||||||||||||||||||||||||
| Matsuda ISI | Prediabetic | -0.462 | -0.248 | < 0.001 | < 0.001 | < 0.001 | |||||||||||||||||||||||||||||||||||||||||||||||||||||||||||||||||||||||||||||||||||||||||||||
| Matsuda ISI | Diabetic | -0.550 | -0.346 | < 0.001 | < 0.001 | < 0.001 | |||||||||||||||||||||||||||||||||||||||||||||||||||||||||||||||||||||||||||||||||||||||||||||
| Fasting insulin | Matsuda ISI | All | -0.830 | -0.301 | < 0.001 | < 0.001 | < 0.001 | ||||||||||||||||||||||||||||||||||||||||||||||||||||||||||||||||||||||||||||||||||||||||||||
| Matsuda ISI | Normal | -0.837 | -0.309 | < 0.001 | < 0.001 | < 0.001 | |||||||||||||||||||||||||||||||||||||||||||||||||||||||||||||||||||||||||||||||||||||||||||||
| Matsuda ISI | Prediabetic | -0.846 | -0.416 | < 0.001 | < 0.001 | < 0.001 | |||||||||||||||||||||||||||||||||||||||||||||||||||||||||||||||||||||||||||||||||||||||||||||
| Matsuda ISI | Diabetic | -0.903 | -0.460 | < 0.001 | < 0.001 | < 0.001 | |||||||||||||||||||||||||||||||||||||||||||||||||||||||||||||||||||||||||||||||||||||||||||||
| 2h glucose-stimulation proinsulin | HbA1c | Diabetic | -0.346 | -0.225 | < 0.001 | < 0.001 | < 0.001 | ||||||||||||||||||||||||||||||||||||||||||||||||||||||||||||||||||||||||||||||||||||||||||||
| Matsuda ISI | All | -0.463 | -0.206 | < 0.001 | < 0.001 | < 0.001 | |||||||||||||||||||||||||||||||||||||||||||||||||||||||||||||||||||||||||||||||||||||||||||||
| Matsuda ISI | Normal | -0.412 | -0.163 | < 0.001 | < 0.001 | < 0.001 | |||||||||||||||||||||||||||||||||||||||||||||||||||||||||||||||||||||||||||||||||||||||||||||
| Matsuda ISI | Prediabetic | -0.480 | -0.269 | < 0.001 | < 0.001 | < 0.001 | |||||||||||||||||||||||||||||||||||||||||||||||||||||||||||||||||||||||||||||||||||||||||||||
| Matsuda ISI | Diabetic | -0.539 | -0.396 | < 0.001 | < 0.001 | < 0.001 | |||||||||||||||||||||||||||||||||||||||||||||||||||||||||||||||||||||||||||||||||||||||||||||
| 2h glucose-stimulation insulin | FPG | Diabetic | -0.446 | -0.350 | < 0.001 | < 0.001 | < 0.001 | ||||||||||||||||||||||||||||||||||||||||||||||||||||||||||||||||||||||||||||||||||||||||||||
| HbA1c | Diabetic | -0.589 | -0.418 | < 0.001 | < 0.001 | < 0.001 | |||||||||||||||||||||||||||||||||||||||||||||||||||||||||||||||||||||||||||||||||||||||||||||
| OGTT2PG | All | 0.434 | 0.223 | < 0.001 | < 0.001 | < 0.001 | |||||||||||||||||||||||||||||||||||||||||||||||||||||||||||||||||||||||||||||||||||||||||||||
| OGTT2PG | Normal | 0.460 | 0.408 | < 0.001 | < 0.001 | < 0.001 | |||||||||||||||||||||||||||||||||||||||||||||||||||||||||||||||||||||||||||||||||||||||||||||
| OGTT2PG | Prediabetic | 0.533 | 0.423 | < 0.001 | < 0.001 | < 0.001 | |||||||||||||||||||||||||||||||||||||||||||||||||||||||||||||||||||||||||||||||||||||||||||||
| Matsuda ISI | All | -0.822 | -0.294 | < 0.001 | < 0.001 | < 0.001 | |||||||||||||||||||||||||||||||||||||||||||||||||||||||||||||||||||||||||||||||||||||||||||||
| Matsuda ISI | Normal | -0.844 | -0.269 | < 0.001 | < 0.001 | < 0.001 | |||||||||||||||||||||||||||||||||||||||||||||||||||||||||||||||||||||||||||||||||||||||||||||
| Matsuda ISI | Prediabetic | -0.876 | -0.384 | < 0.001 | < 0.001 | < 0.001 | |||||||||||||||||||||||||||||||||||||||||||||||||||||||||||||||||||||||||||||||||||||||||||||
| Matsuda ISI | Diabetic | -0.725 | 0.483 | < 0.001 | < 0.001 | < 0.001 | |||||||||||||||||||||||||||||||||||||||||||||||||||||||||||||||||||||||||||||||||||||||||||||
| 2h glucose-stimulation P/I ratio | FPG | Diabetic | 0.401 | 0.408 | < 0.001 | < 0.001 | < 0.001 | ||||||||||||||||||||||||||||||||||||||||||||||||||||||||||||||||||||||||||||||||||||||||||||
| HbA1c | Diabetic | 0.305 | 0.331 | < 0.001 | < 0.001 | < 0.001 | |||||||||||||||||||||||||||||||||||||||||||||||||||||||||||||||||||||||||||||||||||||||||||||
| The association coefficient (Rho) was obtained by spearman method by using SPSS software. Linear regression was applied to derive the regression coefficient (β) and ANOVA was applied to derive the statistical significance (P value). P1 was adjusted for age, sex and P2 age, sex and BMI. Abbreviation: FPG, free plasma glucose. OGTT2PG, plasma glucose levels after 2 hours of oral glucose tolerance test (OGTT). | |||||||||||||||||||||||||||||||||||||||||||||||||||||||||||||||||||||||||||||||||||||||||||||||||||
Hemoglobin A1c was negatively correlated with glucose-stimulated proinsulin and insulin levels in type 2 diabetes
HbAc1 levels is currently used to diagnose T2D [34, 35]. However, in our study, the HbA1c associations with proinsulin, insulin or P/I ratio in the fasting stage or after 2 hours of glucose stimulation were very weak or not significant in the whole population (Supplementary Figure 2). We then compared the correlations in normal, prediabetic and diabetic groups (Figure 3). In normal group, HbAc1 had no significant association with all parameters examined. In prediabetic group, only weak HbA1c associations were observed for glucose-stimulated proinsulin and insulin (Figure 3B, 3D, Rho = -0.203 and Rho = -0.106, respectively), resulting in a low association of glucose-stimulated P/I ratio to HbA1c (Rho = -0.144) (Figure 3F). However, in diabetic group, weak HbAc1 associations were found for fasting insulin and fasting P/I ratio (Figure 3C, 3E, Rho = -0.132, Rho= 0.154, respectively). Medium HbA1c association (Rho = -0.346) was found for glucose-stimulated proinsulin and close to strong association (Rho = -0.589) for glucose-stimulated insulin levels (Figure 3B, 3D). Interestingly, this resulted in a positive correlation of HbA1c with glucose-stimulated P/I (Rho = 0.305) in diabetic group, contrasting to the negative correlation in prediabetic group and maybe normal group as well (Figure 3F). Regression analysis and adjustment were conducted for medium to strong associations, It appeared that the association remained significant after adjusting for sex, age and BMI (Table 1).
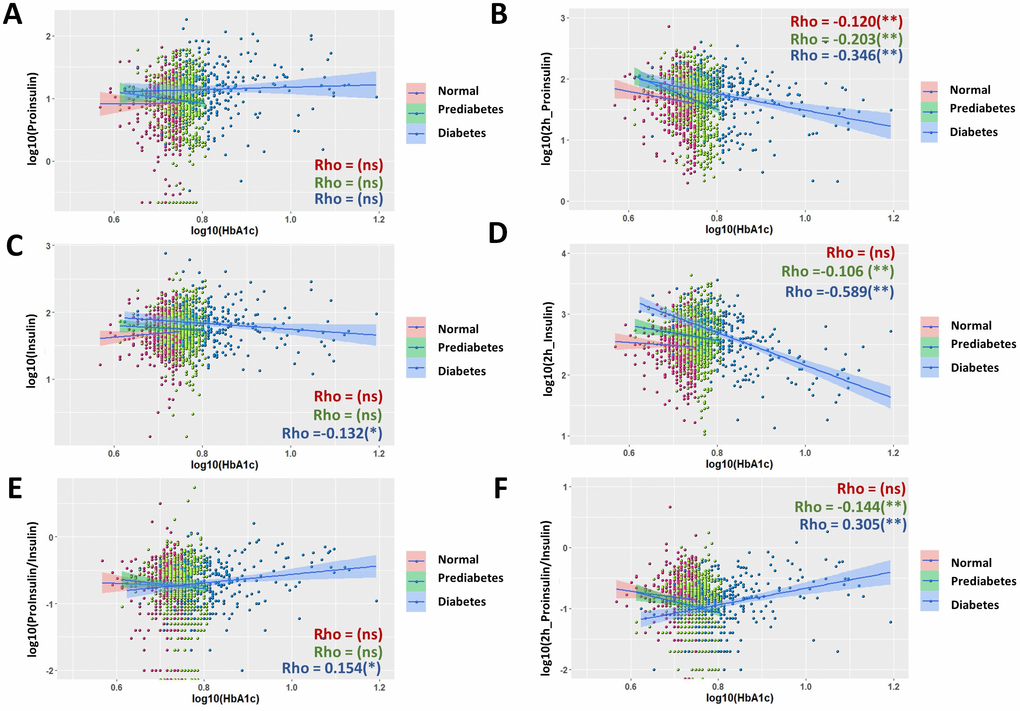
Figure 3. Nonuniform correlations of proinsulin, insulin and P/I ratio with fasting hemoglobin A1C (HbA1c) in normal, prediabetic and diabetic groups. (A) Fasting proinsulin levels were not significant associated HbA1c in all groups of normal, prediabetes and diabetes. Data from 1579 participants were log transformed, scatter plotted and linear modeled by using R language for each subgroup (normal in red, prediabetes in green and diabetes in blue). Association strength was evaluated by Spearman's association coefficient (Rho) using SPSS software: ns, not significant. Shaded line, linear regression with 95% of confidence interval (CI). (B) Negative association of proinsulin levels after 2 hours of glucose stimulation with fasting HbA1c. The association is stronger in diabetic group (Rho = 0.346) than in normal and prediabetic groups. (C) Fasting insulin levels had weak and negative association with fasting HbA1c in diabetic group but not normal and prediabetic groups. (D) Insulin levels after 2 hours of glucose stimulation had no correlation with fasting HbA1c in normal group, weak association in prediabetic group and close to strong association in diabetic group (Rho= -0.589). (E) Fasting P/I ratio and fasting HbA1c were weakly associated in diabetic group not but normal and prediabetic groups. (F) P/I ratio after 2 hours of glucose stimulation was moderately associated with fasting HbA1c in diabetic group, weakly in prediabetic group but not significant in normal group.
Proinsulin and insulin correlation with postprandial glucose in normal, prediabetic and diabetic groups
Postprandial glucose levels, e.g. plasma glucose levels after 2 hour of glucose stimulation in an oral glucose tolerance test (OGTT2hPG), is one of the three indicators used to diagnose T2D [36]. We studied the correlation of this parameter with proinsulin and insulin levels at fasting stage and after glucose stimulation. In the whole population, there were weak associations of OGTT2hPG with fasting proinsulin levels (Supplementary Figure 3A, rho = 0.164), postprandial proinsulin levels (Supplementary Figure 3B, Rho = 0.194) and fasting insulin levels (Supplementary Figure 3C, Rho = 0.164). There was a moderate association between OGTT2hPG with postprandial insulin levels (Supplementary Figure 3D, Rho = 0.434), with a regression coefficient β = 0.223 (Table 1). The association remained significant after adjusting for age, sex and BMI (Table 1). The association of fasting P/I ratio with OGTT2hPG was not significant, however, there was a negative association between postprandial P/I ratio and OGTT2hPG (Supplementary Figure 3F, Rho = -0.228).
Interestingly, the patterns of scatter plot of diabetic groups were quite different from normal and prediabetic groups in some cases (Supplementary Figure 3D–3F), prompting us to study the correlation in the subgroups. Importantly, although the correlations in subgroups generally agreed with that of the whole population (Figure 4A, 4B, 4E), there were some novel observations. Both normal and prediabetic groups had moderate, positive associations between postprandial insulin levels and OGTT2hPG (Figure 4D, Rho = 0.460 and 0.533, respectively). The regression coefficient β were 0.408 and 0.423 for normal and prediabetic groups, respectively, and the associations remained significant after adjusting for age, sex and BMI (Table 1). In contrast, the diabetic group did not show a significant association between postprandial insulin and OGTT2hPG, although trending a negative correlation (Figure 4D). The fasting P/I ratio became significantly associated with OGTT2hPG in diabetic groups (Figure 4E, Rho = 0.172), but not in the whole population (Supplementary Figure 3E). Again, in normal and prediabetic groups, glucose-stimulated P/I ratio were negatively correlated with OGTT2hPG but was trending positively in diabetic group (Figure 4F).
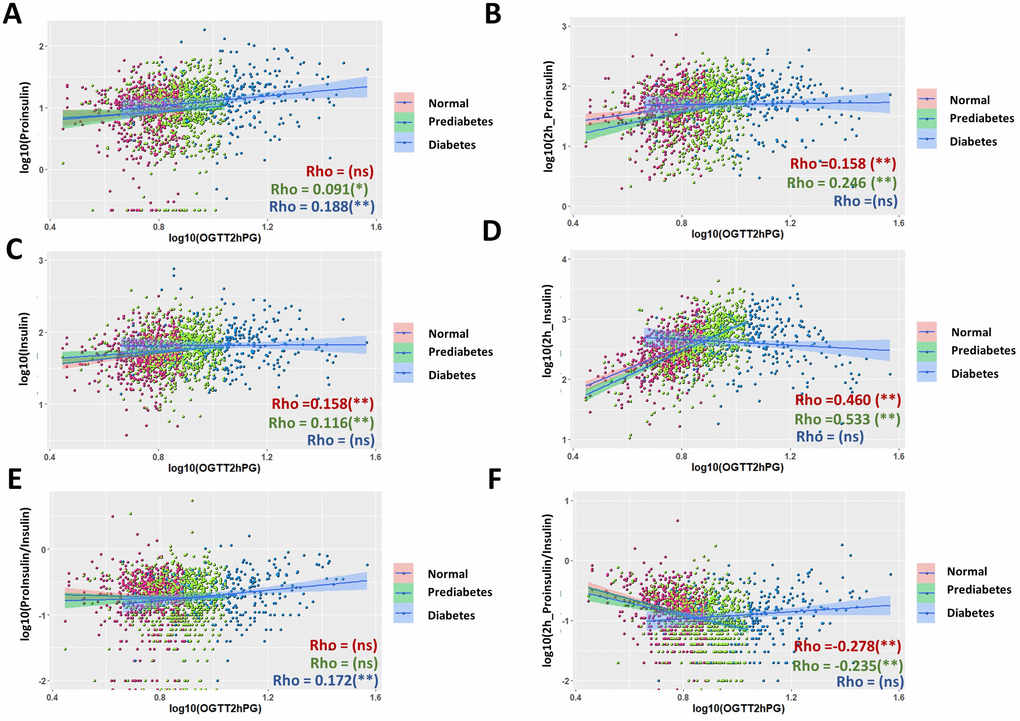
Figure 4. Comparison of associations of proinsulin and insulin levels with plasma glucose levels after 2 hours glucose stimulation in an oral glucose tolerance test (OGTT2hPG) in normal, prediabetic and diabetic groups. (A) Fasting proinsulin levels was better associated with OGTT2hPG in diabetic group than in normal and prediabetic group. Data from 1579 participants were log transformed, scatter plotted and linear modeled by using R language for each subgroup (normal in red, prediabetes in green and diabetes in blue). Association strength was evaluated by Spearman's association coefficient (Rho) using SPSS software: ns, not significant. Shaded line, linear regression with 95% of confidence interval (CI). (B) Proinsulin levels after OGTT was better associated with OGTT2hPG in normal and prediabetic groups (Rho = 1.58 and 0.246, respectively) than in diabetic group. (C) Weak association of fasting insulin levels with OGTT2hPG in normal and prediabetic groups but no significant association in diabetic group. (D) Insulin levels after 2h OGTT had moderate association with OGTT2hPG in normal and prediabetic groups but no in diabetic group. (E) Fasting P/I ratio had weak association with OGTT2hPG in diabetic group but no in normal and prediabetic group. (F) Glucose-stimulated P/I ratio had moderate negative association with OTGG2hPG in normal and prediabetic groups but not in diabetic group.
Tight association of proinsulin levels with Matsuda index across normal, prediabetic and diabetic subgroups
The Matsuda index is composite index for insulin sensitivity, which has been widely used as an important measurement of glucose intolerance and hyperglycemia development [29, 30]. The Matsuda index in this study was calculated from fasting and postprandial glucose and insulin levels in a 2-hour OGTT. Not surprisingly, Matsuda index were highly associated with insulin levels at both fasting stage (Rho = -0.83) and after 2-hour glucose stimulation (Rho = -0.822) in the whole population (Supplementary Figure 4C, 4D). Interestingly, proinsulin levels also had a very good association with Matsuda index: both fasting and postprandial proinsulin levels correlated with Matsuda index with Rho = -0.463 (Supplementary Figure 4A, 4B). However, the P/I ratio at both fasting stage and after 2-hour glucose stimulation showed only weak associations with Matsuda index (Supplementary Figure 4E, 4F). In subgroup analysis, surprisingly, all subgroups followed the same trend as the whole population (Figure 5), although proinsulin levels were slightly better associated with Matsuda index in diabetic group, as compared with those in normal and prediabetic groups. Similarly, all subgroups showed only weak associations between P/I ratio and Matsuda index (Figure 5E, 5F). All moderate (Rho ≥0.3) to strong associations (Rho ≥0.6) remained significant after adjustment for sex, age and BMI (Table 1). Regression coefficient β was also calculated for moderate and strong associations (Table 1).
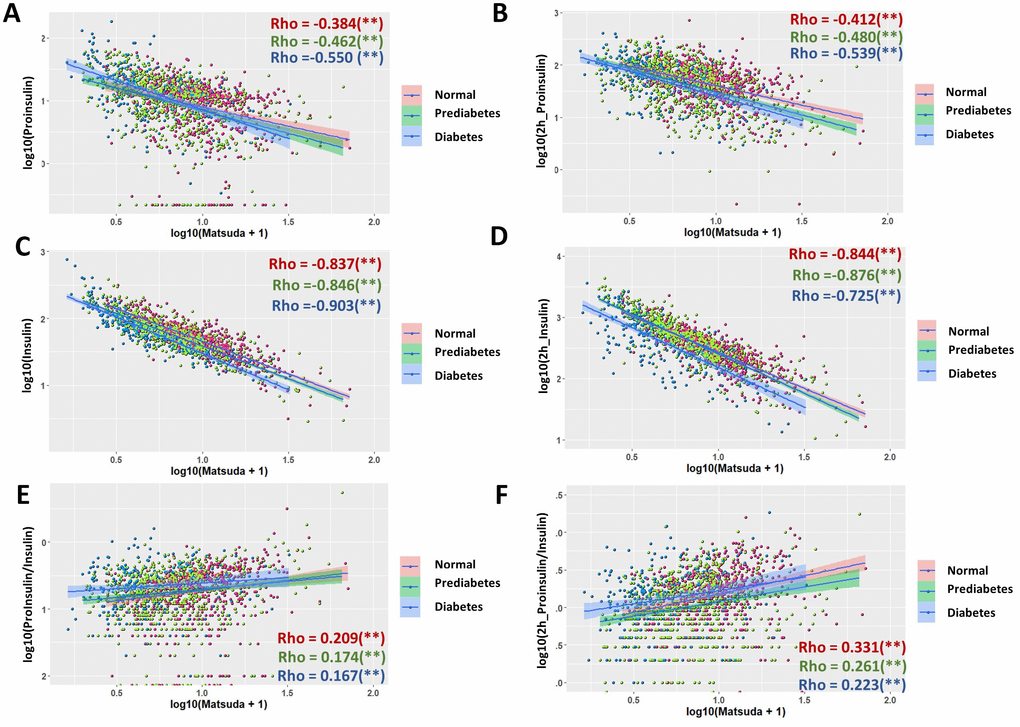
Figure 5. Association of proinsulin, insulin levels and proinsulin to insulin (P/I) ratio with Matsuda Index in normal, prediabetic and diabetic groups. (A) Negative association of fasting proinsulin levels with Matsuda Index in all subgroups with moderate strength. Data from 1579 participants were log transformed, scatter plotted and linear modeled by using R language for each subgroup (normal in red, prediabetes in green and diabetes in blue). Association strength was evaluated by Spearman's association coefficient (Rho) using SPSS software. Shaded line, linear regression with 95% of confidence interval (CI). (B) Glucose-stimulated proinsulin levels were negatively associated with Matsuda index in all subgroups. (C) Fasting insulin levels were strongly associated with Matsuda index in all subgroups. (D) Glucose-stimulated insulin levels were strongly associated with Matsuda index in all subgroups. (E) Fasting P/I ratio was much weaker than proinsulin and insulin levels in association with Matsuda index in all subgroups. (F) Glucose-stimulated P/I ratio was much weaker than proinsulin and insulin levels in association with Matsuda index in all subgroups.
Weak prediction power of proinsulin, insulin and P/I ratio for diabetes in the whole population
The weak association of proinsulin, insulin and P/I ratio with multiple diabetic indicators in the whole population suggest that they are not good predictor of diabetes development. To confirm this possibility, we used the widely applied Receiver Operating Characteristic (ROC) curve to evaluate prediction power of proinsulin, insulin and P/I ratio. As shown in Figure 6, a better predictor such as HbA1c was curving to the left upper corner. Our results showed that, compared to age, which is well correlated to FPG and HbA1c and a moderate predictor of diabetes, all proinsulin, insulin and P/I ratio were weak predictors for diabetes (Figure 6A). After 2-hour glucose stimulation, the proinsulin, insulin and P/I ratio remained weak predictors for diabetes (Figure 6B). Interestingly, the P/I ratio in both fasting and postprandial conditions was the least effective predictor of diabetes, contrasting to some previous studies. These results were consistent with our association studies in the whole population, which suggest that, in the whole population, the proinsulin, insulin and P/I ratio are not powerful predictors of diabetes.
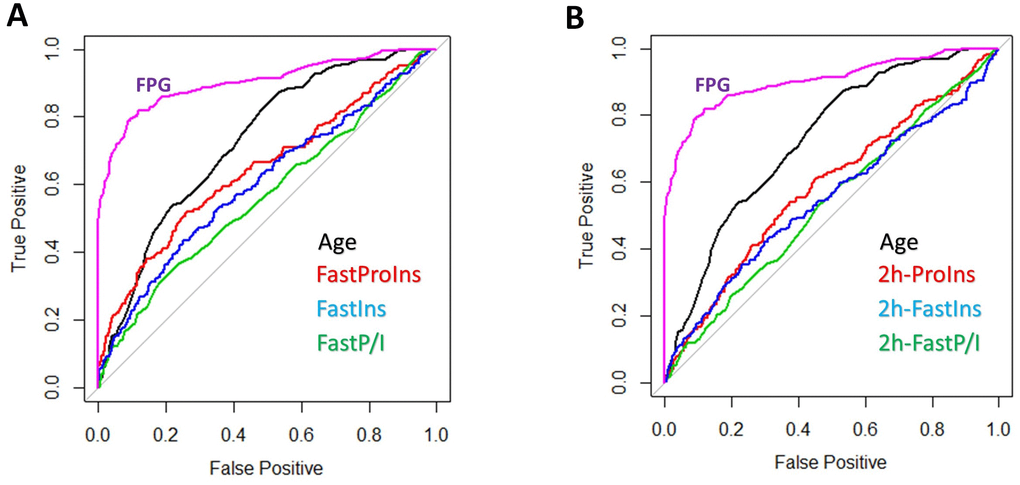
Figure 6. Prediction power of proinsulin, insulin levels and proinsulin to insulin (P/I) ratio for diabetes. (A) Weak prediction power of proinsulin, insulin levels and P/I ratio as compared to age and HbA1c. Data from 1579 individuals were plotted with pROC package in R. HbA1c was one of the three parameters used to define diabetes, therefore a strong predictor (curve to the upper left corner). The diagonal line means no prediction power. All proinsulin, insulin levels and P/I ratio were weaker than age in predicting diabetes and P/I ratio was the worse. (B) Weak prediction power of postprandial proinsulin, insulin levels and P/I ratio as compared to age and HbA1c. All proinsulin, insulin levels and P/I ratio after 2-hour glucose stimulation were weaker than age in predicting diabetes and P/I ratio was the worse.
Discussion
Previous proposals of using proinsulin, insulin and P/I ratio to predict diabetes development are based on the assumptions that they are strongly or at least moderately correlated to diabetes indictors such as FPG, HbA1c and insulin sensitivity. By plotting all the data points in the correlation study, we find that most correlations are too weak to support their predicting function. Interestingly, we notice that subsets of data points do not follow a linear model. This prompts us to subgroup them into normal, prediabetic and diabetic population. By dividing 1579 individuals into subgroups, our study reveals distinct sometimes opposite correlations in different subgroups for the same parameters. Our studies also reveal unexpected correlations of proinsulin and insulin with diabetic indicators in some subgroups. Since such associations have not been systematically compared in normal, prediabetic and diabetic groups, our studies could raise further interests in using subgroup analysis in similar studies.
Weak predicting power of proinsulin, insulin and P/I ratio for type 2 diabetes development
Proinsulin levels, insulin levels and P/I ratio have been shown to be associated with diabetes parameters with various strength in different cohorts [19, 37–41]. We examine in our cohort the correlations and find that, although proinsulin levels, insulin levels and P/I ratio are correlated with diabetes parameters similar to those reported in the literature, the strength of association are generally weak, with Spearman coefficient Rho falling between 0.1 and 0.3. The use of Spearman ranking method results in higher correlation coefficient compared to Pearson method (data not shown). Therefore, the current associations could have been overestimated. Reviewing the past literature, we find that most studies also show very weak associations to diabetes indicators, regardless of whether Pearson association or Spearman ranking is being used [14, 24, 42]. Some previous studies show stronger association but have limited participants or the participants are older in age. Therefore, there are no strong evidence to support proinsulin, insulin and P/I ratio as good predictors of T2D development. Consistently, ROC curve analysis of our cohort show that proinsulin, insulin and P/I ratio are much less effective than age as predictor of diabetes, with P/I ratio as the worse among the three (Figure 6).
The exceptions are their associations with insulin sensitivity as measured by Matsuda index (Figure 5 and Supplementary Figure 4). Fasting and postprandial insulin are both strongly associated with Matsuda index. This is simply due to the fact that Matsuda index is calculated based on both fasting and postprandial insulin levels. What is interesting is that the fasting and postprandial proinsulin levels have moderate and negative association with Matsuda index in all subgroups, suggesting that they could serve as potential predictors of insulin sensitivity and hyperglycemia development.
Subgroup analysis reveals distinct and sometimes opposite patterns of correlations
By careful examination of the scatterplot, we notice in multiple cases that there is a trend of bimodal distribution. For example, postprandial insulin is trending positive at lower FPG but negative at higher FPG (Figure 2D). This observation leads us to subgroup the participants into normal, prediabetic and diabetic group in the association studies. Interestingly, when subgrouping the population, stronger associations appear in certain subgroups, for example postprandial insulin levels and P/I ratio with FPG in diabetic group (Figure 2D, 2E), postprandial proinsulin, insulin and P/I ratio with HbA1c in diabetic group (Figure 3B, 3D, 3E), and postprandial insulin levels with postprandial glucose levels in normal and prediabetic groups (Figure 4D). These results suggest that these metabolic parameters could be strong predictors of T2D development in certain subgroups, but their prediction function awaits further investigation and careful evaluation. To our knowledge, our current study is the first of its kind to systematically compare in each subgroup and the whole population the correlations of proinsulin, insulin and P/I ratio with diabetes parameters.
P/I ratio is worse than proinsulin or insulin levels in predicting hyperglycemia development
Interestingly, although several previous studies suggest that the P/I ratio is as good as or even better than proinsulin or insulin in predicting T2D development [43, 44], we find the opposite. Across multiple panels of association study, we show that compared to proinsulin and insulin, P/I ratio has the worse association with T2D parameters including FPG, HbA1c, postprandial glucose and insulin sensitivity as measured by Matsuda index, whether in the whole population or in the subgroups. We confirm that this discrepancy is not due to the methods in association study, as most previous reports also apply the same software (SPSS) and the same methods (Spearman or Pearson) and we find the P/I ratio remains the least effective predictor by using Pearson analysis (Data not shown). More striking difference is found in the correlation to Matsuda index, where both proinsulin and insulin levels, at both fasting and glucose-stimulated conditions, are tightly correlated to Matsuda index, but not the P/I ratio (Figure 5). Further, ROS analysis confirm that P/I ratio is worse than proinsulin and insulin in predicting diabetes (Figure 6). Our results suggest that, as appose to several early proposals, defect in processing of proinsulin to insulin is not likely a critical contributing factor to T2D development. In previous reports, the reported associations are also generally weaker for P/I ratio as compared to that for proinsulin or insulin [22, 23, 45–47]. Therefore, our results are not inconsistent with the literature. Together, our data argue against using P/I ratio in evaluation of T2D development.
Despite the points mentioned above, there are several caveats worth mentioning. First, our study is focused on a specific group of people living in a restricted area. The1579 individuals in our cohort study are all East Asia ethnicity, living in an Island south to the China mainland. Second, the participants were recruited voluntarily and bias could be introduced as those who were more or less concerned about T2D were more likely to participate. These caveats, among many others, suggest that care should be taken when attempts to extrapolate our results to other studies.
Materials and Methods
Subjects
The current study is part of an ongoing project led by Hainan General Hospital aiming to better understand several health issues of Hainan Province, China. The subjects are ethnically East Asian distributing across the province, including cities and countryside. This study includes 1579 men and women of different age, socioeconomical status and education levels. Such information was collected based on a survey before admitting participants for glucose tolerance test and biometrics measurement. The study was approved by ethical committee of Hainan General Hospital and all participants gave written informed consents. The data collected in this manuscript are completely different from a previous co-authored paper in Hainan Medical Journal (Supplementary Data). The original data can be found in Supplementary Data. The processed data can be found in Supplementary Table 2.
Clinical measurements
Weight was measured by using mechanic scale and height mechanical rod mounted on a wall. Values for weight and height were kept to the nearest 0.1 kg and 0.5 cm, respectively. BMI was calculated based on weight and height, e.g. dividing weight (kg) by the square of height (m3). Waist was measured at the midpoint between the lateral iliac crest and lowest rib to the nearest 0.5 cm. Systolic pressure and diastolic pressure were obtained by standard sphygmomanometer and values were expressed in millimeters of mercury (mmHg). Heartbeat was measured with a pulse oximeter for 3 times and averaged.
Oral glucose tolerance test (OGTT)
A standard 2-hour, 75-gram oral glucose tolerance test (OGTT) protocol was used in this study. Participants were fasted overnight at least for 10 hours. First, blood was drawn at the fasting state. Participants were then required to drink 0.2 kg of a syrupy glucose solution that contains 75 grams of sugar within 2 minutes. After 2 hours, a second blood draw was carried out. Glucose levels, proinsulin levels and insulin levels in these samples were then determined as follows: plasma glucose was measured by using Hexokinase Activity Assay Kit (Abcam). Insulin was determined by using Human Insulin ELISA Kit (Abcam). Proinsulin was measured by using Human proinsulin ELISA Kit (Abcam).
Insulin sensitivity
Insulin sensitivity were evaluated by using Matsuda ISI, which is generated by using the template published at http://mmatsuda.diabetes-smc.jp/english.html, based on fasting and 2-hour glucose-stimulated insulin levels and plasma glucose levels. Detailed information regarding the Matsuda index could be found in this website as well as early publications [29, 30].
Data visualization
Graphs were generated using Graphpad prisim software and Rstudio (Version 1.1.463) installed with ggplot2 and pROC package. For association visualization, data were first converted by log10 to obtain normally distributed data, then analyzed by using linear model either across all data points or data points for normal, prediabetic and diabetic groups. A small number of outliers were removed for visualization purpose.
Statistical analysis
Statistical analyses and association studies were conducted using IBM SPSS version 24. Association was evaluated by binary variable model and correlation coefficient factor Rho were obtained by using spearman’s rank. In this paper, the absolute value of coefficient factor Rho lower than 0.2 is considered not associated, 0.21-0.4 weak association, 0.41-0.6 moderate association, 0.61 and higher strong association. A linear regression model was used to derive the standardized β and P values for moderate or strong associations and the results were adjusted to age, sex and body mass index (BMI) as indicated in the main text.
Supplementary Materials
Conflicts of Interest
The authors have declared no conflicts of interest.
Funding
This study was supported by Hainan Provincial Key Research and Development Project (ZDYF2018130) and Hainan Medical Research Project (1801320249A2001).
References
- 1. Caspersen CJ, Thomas GD, Boseman LA, Beckles GL, Albright AL. Aging, diabetes, and the public health system in the United States. Am J Public Health. 2012; 102:1482–97. https://doi.org/10.2105/AJPH.2011.300616 [PubMed]
- 2. Menke A, Casagrande S, Geiss L, Cowie CC. Prevalence of and Trends in Diabetes Among Adults in the United States, 1988-2012. JAMA. 2015; 314:1021–29. https://doi.org/10.1001/jama.2015.10029 [PubMed]
- 3. Longo M, Bellastella G, Maiorino MI, Meier JJ, Esposito K, Giugliano D. Diabetes and Aging: From Treatment Goals to Pharmacologic Therapy. Front Endocrinol (Lausanne). 2019; 10:45. https://doi.org/10.3389/fendo.2019.00045 [PubMed]
- 4. Kalyani RR, Golden SH, Cefalu WT. Diabetes and Aging: Unique Considerations and Goals of Care. Diabetes Care. 2017; 40:440–43. https://doi.org/10.2337/dci17-0005 [PubMed]
- 5. Czech MP. Insulin action and resistance in obesity and type 2 diabetes. Nat Med. 2017; 23:804–14. https://doi.org/10.1038/nm.4350 [PubMed]
- 6. Campbell IL, Harrison LC. Molecular pathology of type 1 diabetes. Mol Biol Med. 1990; 7:299–309. [PubMed]
- 7. Gastaldelli A. Role of beta-cell dysfunction, ectopic fat accumulation and insulin resistance in the pathogenesis of type 2 diabetes mellitus. Diabetes Res Clin Pract. 2011 (Suppl 1); 93:S60–65. https://doi.org/10.1016/S0168-8227(11)70015-8 [PubMed]
- 8. Steiner DF, Park SY, Støy J, Philipson LH, Bell GI. A brief perspective on insulin production. Diabetes Obes Metab. 2009 (Suppl 4); 11:189–96. https://doi.org/10.1111/j.1463-1326.2009.01106.x [PubMed]
- 9. Fu Z, Gilbert ER, Liu D. Regulation of insulin synthesis and secretion and pancreatic Beta-cell dysfunction in diabetes. Curr Diabetes Rev. 2013; 9:25–53. https://doi.org/10.2174/157339913804143225 [PubMed]
- 10. Liu M, Wright J, Guo H, Xiong Y, Arvan P. Proinsulin entry and transit through the endoplasmic reticulum in pancreatic beta cells. Vitam Horm. 2014; 95:35–62. https://doi.org/10.1016/B978-0-12-800174-5.00002-8 [PubMed]
- 11. Haataja L, Snapp E, Wright J, Liu M, Hardy AB, Wheeler MB, Markwardt ML, Rizzo M, Arvan P. Proinsulin intermolecular interactions during secretory trafficking in pancreatic β cells. J Biol Chem. 2013; 288:1896–906. https://doi.org/10.1074/jbc.M112.420018 [PubMed]
- 12. Wray GM, Foster SJ, Hinds CJ, Thiemermann C. A cell wall component from pathogenic and non-pathogenic gram-positive bacteria (peptidoglycan) synergises with endotoxin to cause the release of tumour necrosis factor-alpha, nitric oxide production, shock, and multiple organ injury/dysfunction in the rat. Shock. 2001; 15:135–42. https://doi.org/10.1097/00024382-200115020-00010 [PubMed]
- 13. Fritsche A, Madaus A, Stefan N, Tschritter O, Maerker E, Teigeler A, Häring H, Stumvoll M. Relationships among age, proinsulin conversion, and beta-cell function in nondiabetic humans. Diabetes. 2002 (Suppl 1); 51:S234–39. https://doi.org/10.2337/diabetes.51.2007.S234 [PubMed]
- 14. Kim NH, Kim DL, Choi KM, Baik SH, Choi DS. Serum insulin, proinsulin and proinsulin/insulin ratio in type 2 diabetic patients: as an index of beta-cell function or insulin resistance. Korean J Intern Med (Korean Assoc Intern Med). 2000; 15:195–201. https://doi.org/10.3904/kjim.2000.15.3.195 [PubMed]
- 15. Haffner SM, Gonzalez C, Mykkänen L, Stern M. Total immunoreactive proinsulin, immunoreactive insulin and specific insulin in relation to conversion to NIDDM: the Mexico City Diabetes Study. Diabetologia. 1997; 40:830–37. https://doi.org/10.1007/s001250050756 [PubMed]
- 16. Bryhni B, Arnesen E, Jenssen TG. Associations of age with serum insulin, proinsulin and the proinsulin-to-insulin ratio: a cross-sectional study. BMC Endocr Disord. 2010; 10:21. https://doi.org/10.1186/1472-6823-10-21 [PubMed]
- 17. Heaton DA, Millward BA, Gray IP, Tun Y, Hales CN, Pyke DA, Leslie RD. Increased proinsulin levels as an early indicator of B-cell dysfunction in non-diabetic twins of type 1 (insulin-dependent) diabetic patients. Diabetologia. 1988; 31:182–84. https://doi.org/10.1007/BF00276853 [PubMed]
- 18. Pfützner A, Kunt T, Hohberg C, Mondok A, Pahler S, Konrad T, Lübben G, Forst T. Fasting intact proinsulin is a highly specific predictor of insulin resistance in type 2 diabetes. Diabetes Care. 2004; 27:682–87. https://doi.org/10.2337/diacare.27.3.682 [PubMed]
- 19. Wareham NJ, Byrne CD, Williams R, Day NE, Hales CN. Fasting proinsulin concentrations predict the development of type 2 diabetes. Diabetes Care. 1999; 22:262–70. https://doi.org/10.2337/diacare.22.2.262 [PubMed]
- 20. Kahn SE, Leonetti DL, Prigeon RL, Boyko EJ, Bergstom RW, Fujimoto WY. Proinsulin levels predict the development of non-insulin-dependent diabetes mellitus (NIDDM) in Japanese-American men. Diabet Med. 1996 (Suppl 6); 13:S63–66. https://doi.org/10.1002/dme.1996.13.s6.63 [PubMed]
- 21. Zethelius B, Byberg L, Hales CN, Lithell H, Berne C. Proinsulin and acute insulin response independently predict Type 2 diabetes mellitus in men—report from 27 years of follow-up study. Diabetologia. 2003; 46:20–26. https://doi.org/10.1007/s00125-002-0995-2 [PubMed]
- 22. Mykkänen L, Haffner SM, Hales CN, Rönnemaa T, Laakso M. The relation of proinsulin, insulin, and proinsulin-to-insulin ratio to insulin sensitivity and acute insulin response in normoglycemic subjects. Diabetes. 1997; 46:1990–95. https://doi.org/10.2337/diab.46.12.1990 [PubMed]
- 23. Haffner SM, Mykkänen L, Valdez RA, Stern MP, Holloway DL, Monterrosa A, Bowsher RR. Disproportionately increased proinsulin levels are associated with the insulin resistance syndrome. J Clin Endocrinol Metab. 1994; 79:1806–10. https://doi.org/10.1210/jcem.79.6.7989488 [PubMed]
- 24. Vangipurapu J, Stančáková A, Kuulasmaa T, Kuusisto J, Laakso M. Both fasting and glucose-stimulated proinsulin levels predict hyperglycemia and incident type 2 diabetes: a population-based study of 9,396 Finnish men. PLoS One. 2015; 10:e0124028. https://doi.org/10.1371/journal.pone.0124028 [PubMed]
- 25. Birkeland KI, Torjesen PA, Eriksson J, Vaaler S, Groop L. Hyperproinsulinemia of type II diabetes is not present before the development of hyperglycemia. Diabetes Care. 1994; 17:1307–10. https://doi.org/10.2337/diacare.17.11.1307 [PubMed]
- 26. Schuit FC, In’t Veld PA, Pipeleers DG. Glucose stimulates proinsulin biosynthesis by a dose-dependent recruitment of pancreatic beta cells. Proc Natl Acad Sci USA. 1988; 85:3865–69. https://doi.org/10.1073/pnas.85.11.3865 [PubMed]
- 27. Mako ME, Starr JI, Rubenstein AH. Circulating proinsulin in patients with maturity onset diabetes. Am J Med. 1977; 63:865–69. https://doi.org/10.1016/0002-9343(77)90538-1 [PubMed]
- 28. Wang PW, Abbasi F, Carantoni M, Chen YD, Azhar S, Reaven GM. Insulin resistance does not change the ratio of proinsulin to insulin in normal volunteers. J Clin Endocrinol Metab. 1997; 82:3221–24. https://doi.org/10.1210/jc.82.10.3221 [PubMed]
- 29. Matsuda M, DeFronzo RA. Insulin sensitivity indices obtained from oral glucose tolerance testing: comparison with the euglycemic insulin clamp. Diabetes Care. 1999; 22:1462–70. https://doi.org/10.2337/diacare.22.9.1462 [PubMed]
- 30. DeFronzo RA, Matsuda M. Reduced time points to calculate the composite index. Diabetes Care. 2010; 33:e93. https://doi.org/10.2337/dc10-0646 [PubMed]
- 31. American Diabetes Association. Diagnosis and classification of diabetes mellitus. Diabetes Care. 2004 (Suppl 1); 27:S5–10. https://doi.org/10.2337/diacare.27.2007.S5 [PubMed]
- 32. American Diabetes Association. Standards of medical care in diabetes—2010. Diabetes Care. 2010 (Suppl 1); 33:S11–61. https://doi.org/10.2337/dc10-S011 [PubMed]
- 33. El Shabrawy AM, Elbana KA, Abdelsalam NM. Proinsulin/insulin ratio as a predictor of insulin resistance and B-cell dysfunction in obese Egyptians ((insulin resistance & B-cell dysfunction in obese Egyptians)). Diabetes Metab Syndr. 2019; 13:2094–96. https://doi.org/10.1016/j.dsx.2019.04.044 [PubMed]
- 34. Nomura K, Inoue K, Akimoto K. A two-step screening, measurement of HbA1c in association with FPG, may be useful in predicting diabetes. PLoS One. 2012; 7:e36309. https://doi.org/10.1371/journal.pone.0036309 [PubMed]
- 35. Gillett MJ. International Expert Committee report on the role of the A1c assay in the diagnosis of diabetes: Diabetes Care 2009; 32(7): 1327-1334. Clin Biochem Rev. 2009; 30:197–200. [PubMed]
- 36. Rushforth NB, Miller M, Bennett PH. Fasting and two-hour post-load glucose levels for the diagnosis of diabetes. The relationship between glucose levels and complications of diabetes in the Pima Indians. Diabetologia. 1979; 16:373–79. https://doi.org/10.1007/BF01223157 [PubMed]
- 37. Pradhan AD, Manson JE, Meigs JB, Rifai N, Buring JE, Liu S, Ridker PM. Insulin, proinsulin, proinsulin:insulin ratio, and the risk of developing type 2 diabetes mellitus in women. Am J Med. 2003; 114:438–44. https://doi.org/10.1016/S0002-9343(03)00061-5 [PubMed]
- 38. Kahn SE, Leonetti DL, Prigeon RL, Boyko EJ, Bergstrom RW, Fujimoto WY. Relationship of proinsulin and insulin with noninsulin-dependent diabetes mellitus and coronary heart disease in Japanese-American men: impact of obesity—clinical research center study. J Clin Endocrinol Metab. 1995; 80:1399–406. https://doi.org/10.1210/jcem.80.4.7714116 [PubMed]
- 39. Kahn SE, Leonetti DL, Prigeon RL, Boyko EJ, Bergstrom RW, Fujimoto WY. Proinsulin as a marker for the development of NIDDM in Japanese-American men. Diabetes. 1995; 44:173–79. https://doi.org/10.2337/diab.44.2.173 [PubMed]
- 40. Hanley AJ, D’Agostino R
Jr , Wagenknecht LE, Saad MF, Savage PJ, Bergman R, Haffner SM, Insluin Resistance Atrherosclerosis S, and Insluin Resistance Atrherosclerosis Study. Increased proinsulin levels and decreased acute insulin response independently predict the incidence of type 2 diabetes in the insulin resistance atherosclerosis study. Diabetes. 2002; 51:1263–70. https://doi.org/10.2337/diabetes.51.4.1263 [PubMed] - 41. Nijpels G, Popp-Snijders C, Kostense PJ, Bouter LM, Heine RJ. Fasting proinsulin and 2-h post-load glucose levels predict the conversion to NIDDM in subjects with impaired glucose tolerance: the Hoorn Study. Diabetologia. 1996; 39:113–18. https://doi.org/10.1007/BF00400421 [PubMed]
- 42. Mykkänen L, Zaccaro DJ, Hales CN, Festa A, Haffner SM. The relation of proinsulin and insulin to insulin sensitivity and acute insulin response in subjects with newly diagnosed type II diabetes: the Insulin Resistance Atherosclerosis Study. Diabetologia. 1999; 42:1060–66. https://doi.org/10.1007/s001250051271 [PubMed]
- 43. Larsson H, Ahrén B. Relative hyperproinsulinemia as a sign of islet dysfunction in women with impaired glucose tolerance. J Clin Endocrinol Metab. 1999; 84:2068–74. https://doi.org/10.1210/jc.84.6.2068 [PubMed]
- 44. Saisho Y, Maruyama T, Hirose H, Saruta T. Relationship between proinsulin-to-insulin ratio and advanced glycation endproducts in Japanese type 2 diabetic subjects. Diabetes Res Clin Pract. 2007; 78:182–88. https://doi.org/10.1016/j.diabres.2007.03.014 [PubMed]
- 45. Yoshioka N, Kuzuya T, Matsuda A, Taniguchi M, Iwamoto Y. Serum proinsulin levels at fasting and after oral glucose load in patients with type 2 (non-insulin-dependent) diabetes mellitus. Diabetologia. 1988; 31:355–60. https://doi.org/10.1007/BF02341503 [PubMed]
- 46. Lorenzo C, Hanley AJ, Rewers MJ, Haffner SM. Disproportionately elevated proinsulinemia is observed at modestly elevated glucose levels within the normoglycemic range. Acta Diabetol. 2014; 51:617–23. https://doi.org/10.1007/s00592-014-0565-3 [PubMed]
- 47. Røder ME, Porte D
Jr , Schwartz RS, Kahn SE. Disproportionately elevated proinsulin levels reflect the degree of impaired B cell secretory capacity in patients with noninsulin-dependent diabetes mellitus. J Clin Endocrinol Metab. 1998; 83:604–08. https://doi.org/10.1210/jc.83.2.604 [PubMed]