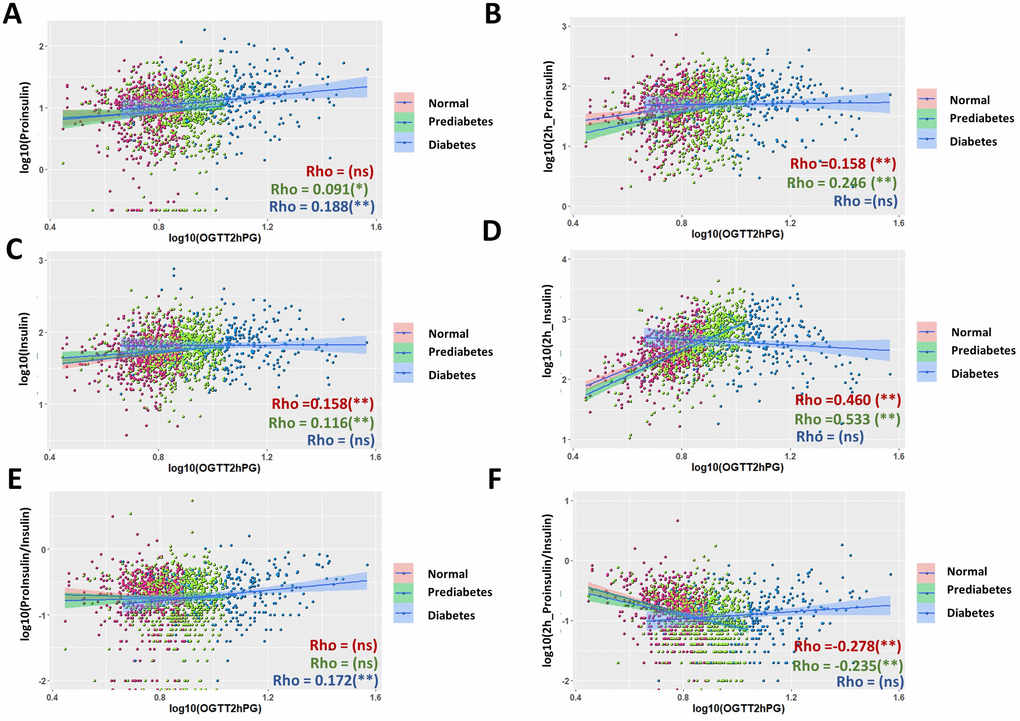
Figure 4.Comparison of associations of proinsulin and insulin levels with plasma glucose levels after 2 hours glucose stimulation in an oral glucose tolerance test (OGTT2hPG) in normal, prediabetic and diabetic groups. (A) Fasting proinsulin levels was better associated with OGTT2hPG in diabetic group than in normal and prediabetic group. Data from 1579 participants were log transformed, scatter plotted and linear modeled by using R language for each subgroup (normal in red, prediabetes in green and diabetes in blue). Association strength was evaluated by Spearman's association coefficient (Rho) using SPSS software: ns, not significant. Shaded line, linear regression with 95% of confidence interval (CI). (B) Proinsulin levels after OGTT was better associated with OGTT2hPG in normal and prediabetic groups (Rho = 1.58 and 0.246, respectively) than in diabetic group. (C) Weak association of fasting insulin levels with OGTT2hPG in normal and prediabetic groups but no significant association in diabetic group. (D) Insulin levels after 2h OGTT had moderate association with OGTT2hPG in normal and prediabetic groups but no in diabetic group. (E) Fasting P/I ratio had weak association with OGTT2hPG in diabetic group but no in normal and prediabetic group. (F) Glucose-stimulated P/I ratio had moderate negative association with OTGG2hPG in normal and prediabetic groups but not in diabetic group.