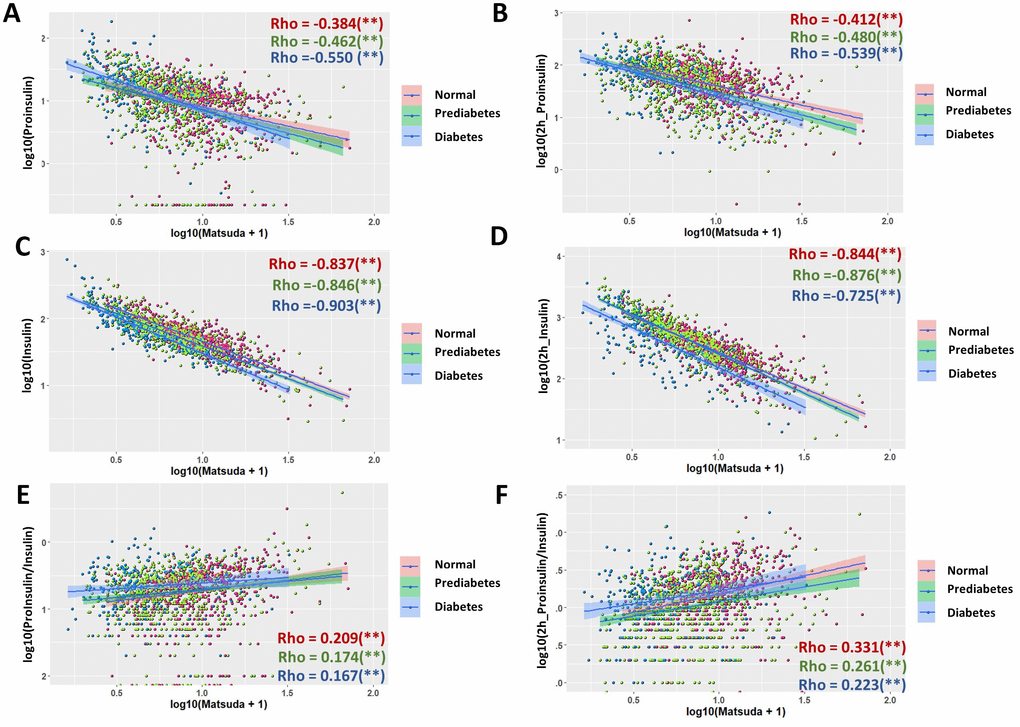
Figure 5.Association of proinsulin, insulin levels and proinsulin to insulin (P/I) ratio with Matsuda Index in normal, prediabetic and diabetic groups. (A) Negative association of fasting proinsulin levels with Matsuda Index in all subgroups with moderate strength. Data from 1579 participants were log transformed, scatter plotted and linear modeled by using R language for each subgroup (normal in red, prediabetes in green and diabetes in blue). Association strength was evaluated by Spearman's association coefficient (Rho) using SPSS software. Shaded line, linear regression with 95% of confidence interval (CI). (B) Glucose-stimulated proinsulin levels were negatively associated with Matsuda index in all subgroups. (C) Fasting insulin levels were strongly associated with Matsuda index in all subgroups. (D) Glucose-stimulated insulin levels were strongly associated with Matsuda index in all subgroups. (E) Fasting P/I ratio was much weaker than proinsulin and insulin levels in association with Matsuda index in all subgroups. (F) Glucose-stimulated P/I ratio was much weaker than proinsulin and insulin levels in association with Matsuda index in all subgroups.