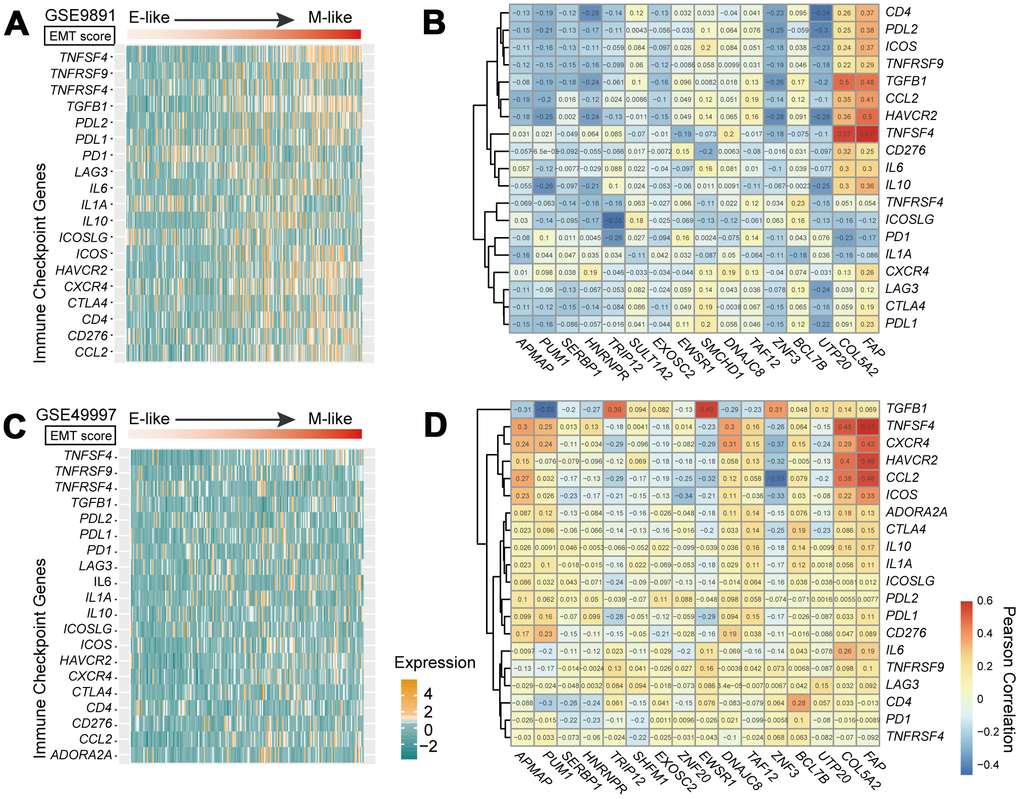
Figure 5.Immune checkpoint genes in the EMT. (A, C) Heatmap of mRNA expression levels of 20 immune checkpoint genes in GSE9891 (A) and GSE49997 (C) OvCa datasets. Tumor samples within each dataset were ordered according to EMT score (upper panels). (B, D) Correlations of expression levels between 18 genes in the 16-GPS and 20 immune checkpoint-related genes in the GSE9891 (B) and GSE49997 (D) OvCa datasets, tested by Pearson correlation analyses. Rows represent immune checkpoint genes, and columns represent genes in the 16-GPS.