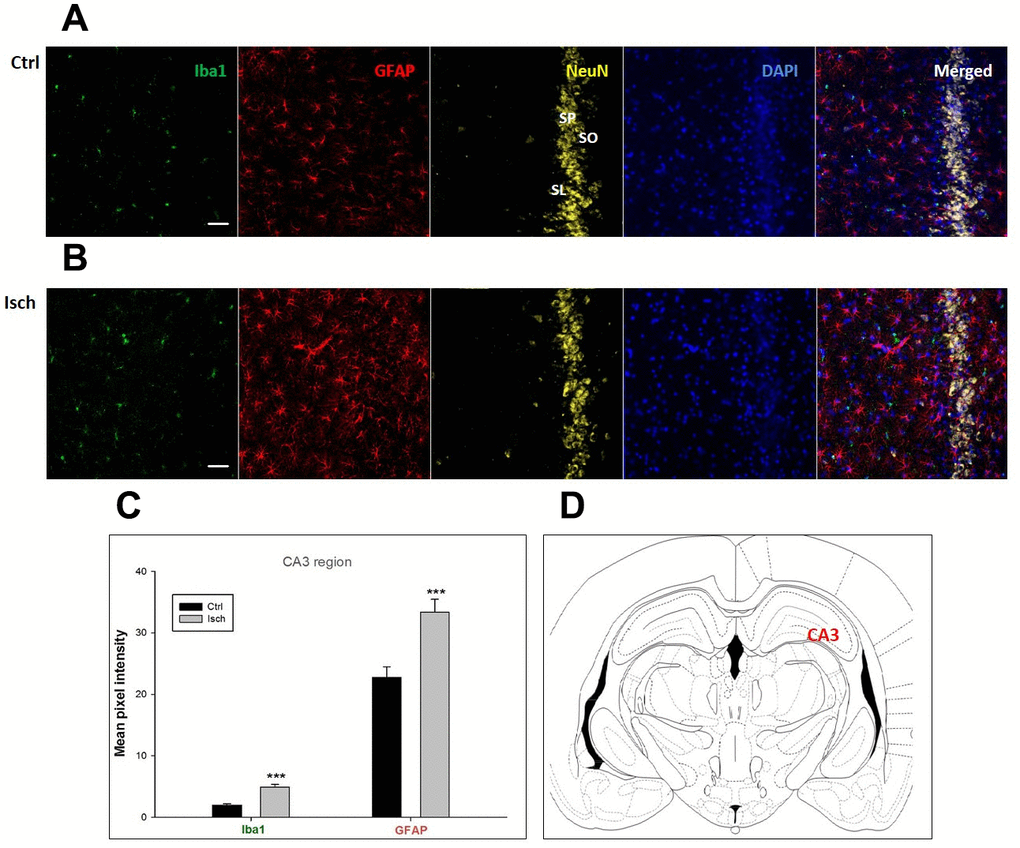
Figure 2.Confocal images of microglia and astrocytes in the post-ischemic CA3 region of the rat brain. Fourfold immunofluorescence labeling microglia with Iba1 (green), astrocytes with GFAP (red), neurons with NeuN (yellow), and nuclei with DAPI (blue). SO – stratum oriens, SP – stratum pyramidale, SL – stratum lacunosum. The scale bar represents 50 μm. (A) Ctrl – control brain, (B) Isch – post-ischemic brain, (C) Quantification of the mean pixel intensities for Iba1 and GFAP signals of post-ischemic vs. control animals with 2 years survival. Values are presented as mean ± SEM. *** p<0.001. nCtrl = 18, nIsch = 18, n = number of analyzed cross sections. (D) Schematic representation of the rat hippocampus level with CA3 region indicated.