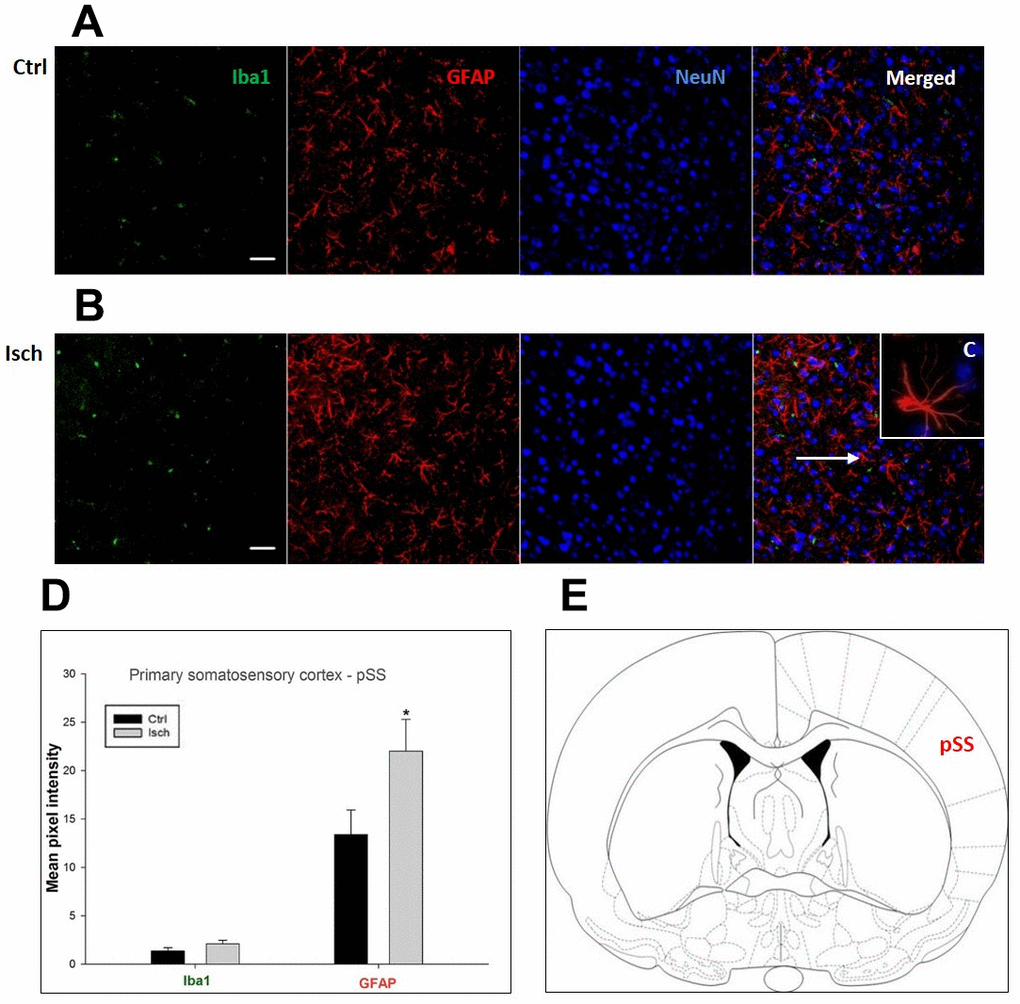
Figure 5.Confocal images of microglia and astrocytes in the post-ischemic primary somatosensory cortex (pSS) of the rat brain. Triple immunofluorescence labeling microglia with Iba1 (green), astrocytes with GFAP (red), and neurons with NeuN (blue). The scale bar represents 50 μm. (A) Ctrl – control brain, (B) Isch – post-ischemic brain, (C) Inset indicating an astrocyte interaction with neurons (8x), (D) Quantification of the mean pixel intensities for Iba1 and GFAP signals of post-ischemic vs. control animals with 2 years survival. Values are presented as mean ± SEM. * p<0.05. nCtrl = 11, nIsch = 11, n = number of analyzed cross sections. (E) Schematic representation of the rat striatal level with pSS region indicated.